


Hi,
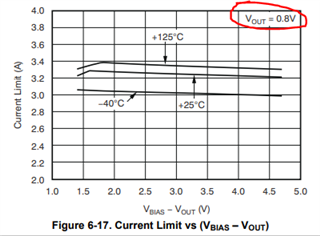
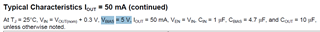
In datasheet of TPS748, condition of typical characteristic with VBIAS=5V for testing. However, figure 6-17 which show current limit curves illustrates relationship between ICL and (VBIAS-VOUT), and Vout = 0.8V is noted at chart, and only figure 6-17 notes Vout=0.8V. From my understanding, this mean that the curves Fig 6-17 are following VBIAS range with Vout=0.8V fix, and it’s totally opposite to electrical conditions. Could you help to clarify the exact mean of Fig 6-17 curves? And have any special reason to write Vout = 0.8V in chart? Thank you.
Best regards,
Randy

