This thread has been locked.

If you have a related question, please click the "Ask a related question" button in the top right corner. The newly created question will be automatically linked to this question.

TPS3702: V_IT+(OV) / V_IT-(UV) minimum and maximum tolerance values

Part Number: TPS3702
Other Parts Discussed in Thread: TPS3703,

Team,

my customer wants to use the device for an aerospace application. They are currently looking at worst case scenarios.

The min/max values of V_IT+(OV) / V_IT-(UV) in the datasheet are for temp range -40°C to +125°C .
Their application is mainly working in temp range -20°C to +70°C. 

Is it possible to further narrow down the limits for V_IT+(OV) / V_IT-(UV) in this tighter temp range?
Other ideas would be to reduce other parameters such as decreased stress or dependencies from supply voltage to also narrow down the limits.

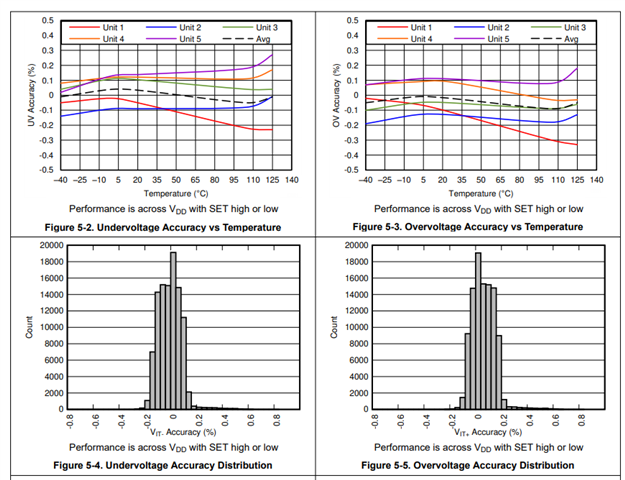
FYI, I have discussed figures 5-2 and 5-3 with them, but since these are just based on example measurements, it is of limited value to them. This performance snapshot is not representative for a general statement.

Best regards

  • Hello,

    Sorry but we do not have accuracy data for a decreased temperature range. 

    If separate UV and OV outputs are not needed, TPS3703 is currently our most accurate supervisor. It has window OV and UV monitoring and an accuracy of 0.25% typ and 0.7% max from -40 to 125C compared to TPS3702 0.9% max.

    Thanks,

    Walter

  • Can we say which proportion of the 0.9% tolerance changes depending on temperature (in the end, it is "just"resistors and comparators) and which is "factory-made" – i.e. production tolerance?

    Thanks

  • Hello Franziskus,

    In the TPS3702 datasheet Figures 5-2 and 5-3 show the temperature dependant portion of the overall accuracy and Figures 5-4 and 5-5 show the initial production tolerance. The overall 0.9% accuracy is the combination of both of these. There is also typically guard bands added to spec to account for production variances but we do not disclose these. The temperature figures are only based on the typical measurement of 5 parts but the initial accuracy distribution uses a much higher sample count. The TPS3703 datasheet contains similar figures.


    Thanks,

    Walter