This thread has been locked.

If you have a related question, please click the "Ask a related question" button in the top right corner. The newly created question will be automatically linked to this question.

UCC27714: Require Graphs of Source,Sink current Vs Ambient temperature.

Part Number: UCC27714

Tool/software:

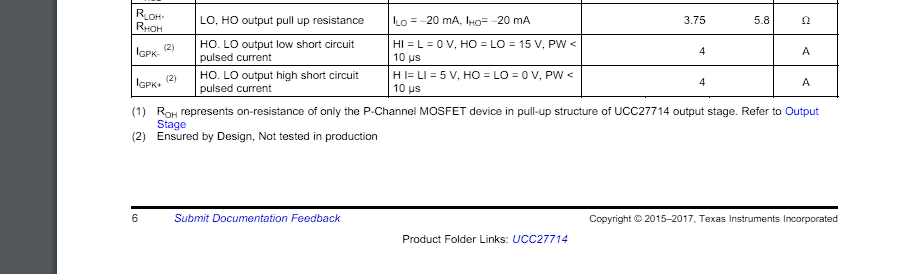
Dear team I have chosen this IC for my inverter Gate driver application. Its mentioned as 4A as max. value for the Source & sink peak currents. Any way I would like to have an approximation how the maximum value varies as the ambient temperature changes.

So, please provide me the graph of Source,Sink current Vs Ambient temperature.

This information lets me take informed desicion about my design. kindly, let me have a quick response.

  • Hey,

    Thank you for reaching out to TI with your question regarding the UCC27714.

    The 4A rating is a typical value for peak source/sink current and is rated for -40 to 125C as outlined in the test conditions. This is not a maximum value and is a peak when the driver begins to charge the capacitive load of the gate charge of the FET.

    Let me know if there are any further questions.

    Thank you,

    William Moore