This thread has been locked.

If you have a related question, please click the "Ask a related question" button in the top right corner. The newly created question will be automatically linked to this question.

BQ28Z610: Application issues of chips

Part Number: BQ28Z610
Other Parts Discussed in Thread: GPCRB

Tool/software:

Supplement the entire testing process and total data as follows:
testing procedure

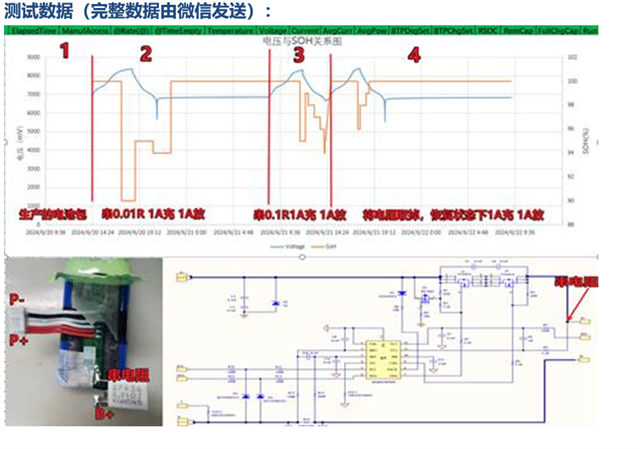
Health verification of room temperature resistance value Sample: 1 piece
Instrument: Lithium battery secondary charging and discharging equipment
1. Charge the empty battery at 1ACC to full charge voltage and 0.02CCV to full charge
Pressure. If the sample has already been prepared from the battery supplier, it can be directly tested.
2. Record the initial value of SOH (SOH1)
3. Connect a 0.01 ohm resistor in series to the PACK and perform a full charge to full discharge before discharging
Record the SOH value (SOH2) during the electrical process
4. Connect a 0.1 ohm resistor to the PACK and perform a full charge to full discharge before discharging
1.SOH1>SOH2>SOH3
2. SOH has no jump during a single discharge process

Test data (complete data will be attached later):

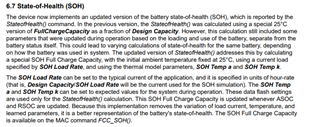
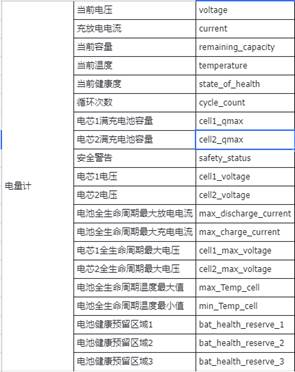
Question for Testing: It appears that SOH can fluctuate significantly under many conditions, even if the cell is equipped with a resistor (simulating an increase in internal resistance of 100 milliohms), SOH may still recover to 100%, making it unclear how to use this important indicator in the field and even questioning its accuracy. This has also raised questions about the significance of introducing a capacity meter. Question 1: Since customers are unable to know the SOH change, please provide a SOH range limit for us to use for battery health warning. Yellow means we will send a message to customers every day saying the battery needs to be replaced. Red means it is not allowed to use. Please provide a suggested percentage for these percentages (can be divided by temperature, voltage, or whether it is read during charging or discharging, or other ways, based on TI's recommendations. Newland software can handle this). Low temperature: 15°C or below SOH yellow warning % SOH red warning %: Normal temperature: 15°C to 40°C SOH yellow warning % SOH red warning %: High temperature: 40°C or above SOH yellow warning % SOH red warning %: Question 2: In addition, please provide information based on the actual usage of your other customers. If we can collect information from the power meter (voltage, current, temperature, and all registers in the power meter) through the network, which information would you need to remotely assess the battery condition? Currently, we have designed the following, please let us know if there is any additional or omitted information:

Finally, the supplementary data is as follows:

Comprehensive Data Chart of SOH Changes in 100 Cell String Resistance Test.xlsx

  • Hello,

    I will need time to look into this and discuses with other members on my team.

    Regards,

    Nick Richards

  • Please help provide a detailed answer as soon as possible. The customer is going crazy!

  • Hello, 

    Can you provide us with the gg file from the gauge? Essentially we want to see if these parameters are set correctly.

    Also, it will be important for us to see the FCC_SOH value throughout the test to see how this value is changing. This isn't provided in the log file and is available through the mac access commands. Can you run tests using the same procedure above but also tracking the FCC_SOH value. 

    Can also run additional testing without using the resistor in series with the pack and maybe run that test for 3 cycles to see if SOH also fluctuate under a normal use condition. The algorithm that is used to calculate SOH is pretty complex. What my hypothesis right now is that the action of adding the resistor in series with the pack is essentially tricking the algorithm because in a normal use case we do not expect the internal impedance of the battery to significantly change within a few cycles. This is expected to slowly increase over hundreds of cycles.

    Regards,

    Nick Richards

  • 1. It can be confirmed firstly that there will be no fluctuation in SOH under normal usage conditions without using series resistors and running three cycle tests. The GG file can be provided, which is downloaded by the battery supplier as follows:

    SOH TEST GG FILE.gg.csv

    But when tested under high or low temperature conditions, because of the high temperature, the charging chip with JEITA is definitely not fully charged, and then the internal resistance is large and cannot be fully discharged at low temperature. SOH also exists fluctuation. For example, when the battery is charged in an air-conditioned room at 24 degrees Celsius, and then the customer goes out (-10 degrees Celsius) to the cashier. 2. I can ignore the fluctuation of SOH. But as a user, if you could provide the following parameters and guide us in software design, that would be great. The SOH range limit is used for us to make battery health warnings. Yellow means that we will send a message to customers every day saying that the battery needs to be replaced. Red means that it is not allowed to use. These percentages, please help provide a suggested value (can be divided according to temperature, voltage, or whether it is read when charging or discharging, or other ways, depending on the suggestions of the TI original factory, and the software here at Newland can be designed accordingly). Low temperature: Below 15 degrees Celsius SOH yellow warning % SOH red warning %: Normal temperature: 15 degrees Celsius to 40 degrees Celsius SOH yellow warning % SOH red warning %: High temperature: Above 40 degrees Celsius SOH yellow warning % SOH red warning %: 3、Hundreds of rounds of aging tests have been conducted, but the feasibility of real-world user battery introduction tests is very low. Users would need to spend 2-3 months monitoring the battery gauge information and it is almost impossible to achieve. 4、Is it possible to view FCC_SOH through Mac access command? And is it also necessary to use an upper computer? We can communicate the testing steps together. I can refer to the steps for implementation here. Additionally, I hope that TI can conduct this experiment as well. I can send out the battery pack for the experiment to be conducted simultaneously.

  • Hello,

    Thank you for confirming that SOH will behave properly when used in normal conditions. If the gauge is going to be used in environments with very low and very high temperature then you will need to run the GPCRB tool to get updated thermal parameters for the gauge. https://www.ti.com/lit/ug/sluubd0/sluubd0.pdf

    After running this tool, it will report new "temp k" and "temp a" values that should be used for SOH Temp A and SOH Temp K. The gauge uses these parameters when reporting SOH in temperatures outside of normal conditions. After running the GPCRB tool and getting the new report, then you should test again at the extreme temperatures and check if you still see SOH fluctuations. 

    I want to attempt to solve the issue with SOH fluctuations first before going into alternate solutions of software design for your own SOH calculations. I wouldn't be able to share any part of the algorithm that we use for the gauge and I can not share data that was collected from our other customers.

    Regards,

    Nick Richard