This thread has been locked.

If you have a related question, please click the "Ask a related question" button in the top right corner. The newly created question will be automatically linked to this question.

LM25149-Q1EVM-2100: Bode plot quetion

Part Number: LM25149-Q1EVM-2100

Tool/software:

Hi team,

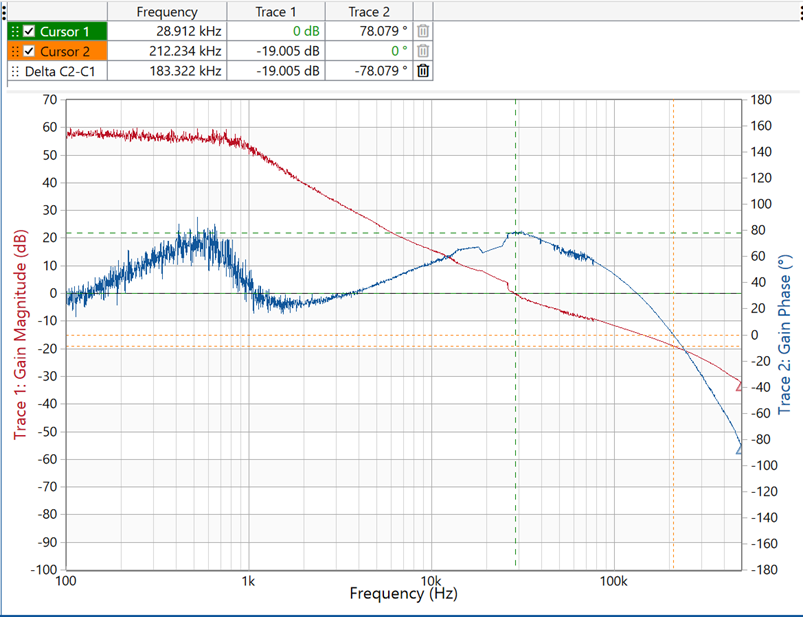
I used Bode100 to test frequency response of EVM. Vin=18V, 8A-resistive load, and the phase starts from -10° and reach 80° at cross frequency, which is only 29kHz.

Could you help explain the difference between the test plot and datasheet plot?
Thank you very much.

Best,

Yian Luo

  • Hello

    The strange phase plot at very low frequencies is probably an artifact of the internal circuits connected to that node.

    Also, it is difficult to make accurate measurements at such low frequencies.

    You have good bandwidth and phase margin, so your application should be stable.

    Thanks