This thread has been locked.

If you have a related question, please click the "Ask a related question" button in the top right corner. The newly created question will be automatically linked to this question.

BQ40Z50-R2: Application issues

Part Number: BQ40Z50-R2
Other Parts Discussed in Thread: GPCRB, GPCRA0

Tool/software:

Hi,I used the BQ40Z50-r2 module on a 2S1P battery pack and found that the SOC calculation for a single full charge discharge was accurate. However, when I discharged the fully charged battery to about 20% SOC, I stopped discharging and let it sit for more than 18 hours before discharging again. I found that the SOC would jump to 0. I tested three batteries and found that they jumped to 0 at 9%, 7%, and 8%, respectively. After checking the logs, it was found that the full charge capacity FCC also jumped by about 200mAh after jumping to 0. It seems that the FCC estimation error occurred during the static process. Please help me confirm what the problem is. Attached is my. gg.csv configuration file

Atom_Ti_LS_18650_V4.0_20240625.gg.csv

  • Hello Ian,

    Can you also attach a log file from the gauge showing this behavior.

    Regards,

    Adrian

  • Hi,

    I collected the logs recorded by Battery Management Studio. The operation steps are to use a 6A discharge current to stop at around 15% when the battery is fully charged, let it stand for about 3 hours, and then continue using 6A discharge. Upon checking the logs, I found that the voltage reached the cutoff voltage of 2700mv at 9% SOC, triggering a 0 jump. I analyzed three cases of batteries and found that one common feature is that the battery level is low (within 20%) and this phenomenon occurs when the temperature returns to room temperature before discharging. It is likely that the impedance of the battery cell changes after the temperature changes, and the estimated impedance is inaccurate. I have searched for relevant information about this, please help me answer a few questions:
    1. Please confirm the reason for the battery jump based on the provided log
    2. I have completed the learning cycle, can I use GPCRB to optimize the impedance after temperature changes?
    3. The GPCRB tool needs to collect data at room temperature and low temperature separately. Is the static stage after low-temperature discharge placed in a low-temperature box or in a room temperature environment? This is not explained by the GPCRB tool.
    4. Based on the phenomenon I described, is it recommended to use GPCRB tool for optimization? Or do you need to collect relevant logs for further analysis?

    jump_log.csv

  • Hello Ian,

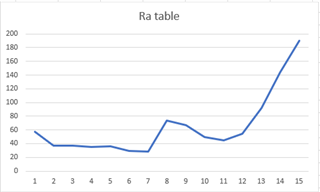
    The reason for the jump in SOC is because of the abnormal Ra table that is learned on the gauge. At grid point 8 there is an abnormal jump in the Ra table which is not expected. This causes the gauge to overestimate the true internal resistance of the battery which causes the gauge to not accurately report SOC. 

    The battery does reach a high temperature during discharge but that does not affect this too much since there is a long relaxation period afterwards, during relax the temperature returns back to normal and FCC updates. 

    I would recommend first running the GPCRA tool to fix the Ra table for your battery: https://www.ti.com/tool/GPCRA0

    This should give you much better SOC reporting.

    Regards,

    Adrian

  • Hi,

    I optimized it using the GPCRA0 tool here. The collected data was fully charged at room temperature and left to stand for 2 hours, then discharged with a current of 6A and left to stand for more than 5 hours. The gg_out.csv returned by the GPCRA0 tool was written into BQ40Z50R2, and I tried to discharge it again until the battery level dropped to 15% and the temperature dropped back to room temperature. When I discharged again, I found that the SOC still skipped 0. According to the Ra value you replied, the estimated internal resistance is high. Theoretically, a high internal resistance should result in faster capacity consumption estimation. However, from the SOC curve, the SOC change rate is not high. The attachment data room.log.csv is the data I collected for the GPCRA0 tool, and Jump_1. csv is the data I imported into the optimized gg.csv file of the GPCRA0 tool and tested again, which showed a jump of 0. Please help me analyze the cause of the anomaly again. If the Ra value is still abnormal, may the data I collected be inaccurate or the collected temperature need to be changed. A simple analysis of the characteristics of the battery cell is that when the low battery returns to room temperature, the internal resistance increases, causing a rapid voltage drop and achieving a cutoff jump. We hope to optimize this problem through BQ40Z50R2.

    room_log.csv

    Jump_1.csv

  • Hello Ian,

    Can you please share the current gg file from the gauge?

    Regards,

    Adrian

  • Hi,

    The gg_out.gg.csv file is written, and the Jump.gg.csv file is after testing the SOC jump. Please help analyze it. Thank you!

    Jump.gg.csv

    8623.gg_out.gg.csv

  • Hello Ian,

    Please allow me some time to review the data.

    Regards,

    Adrian

  • Hi,

    Okay, please let me know if you have any analysis results or need other relevant information for analysis. Thank you!

  • Hello Ian,

    As I review the data, can you run 3 more charge, relax, discharge cycles and collect the data for that. I want to see if accuracy improves over multiple cycles as the gauge will continue to learn and adjust over time.

    Regards,

    Adrian

  • Hi,

    I want to know if for the discharge process of the cyclic operation, we need to keep it at about 15% soc until the temperature is stable and then discharge, or just discharge it directly to the cut-off voltage. At present, in the test of fully charging, leaving it idle, and discharging to the cut-off voltage, the soc change in this process is normal and the accuracy is right. The attachment is the log data for one cycle. If you need to continue the cycle, please help me confirm the cycle steps and the charging and discharging current. Thanks!

    3162.cycle.log

    cycle_1.gg.csv

  • Hello Ian,

    This is good news that the SOC is being tracked properly. Now, I wanted to ask what is the normal current load that will used in the end application? Will the end application have a constant or close to constant discharge until terminate voltage?

    Regards,

    Adrian

  • Hi,

    My application field is for drones. The stable discharge current is 5 to 6 amps. The maximum fluctuation can reach a peak of 15 amps. In actual use, it won't be discharged to the cut-off voltage because 5% of the power is reserved. The current at the end of the flight gradually drops from 6 amps to 700 milliamps.

  • Hello Ian,

    I would recommend simulating the same load profile for the drone and gather log files from the gauge to see if the gauge can accurately gauge your application.

    Regards,

    Adrian

  • Hi,

    I use a 6A discharge and then let it stand still to simulate the actual test process of a drone. A really complete estimate of the flight power is accurate (from 100% to 0%). But we'll do some application tests for related situations. At present, this test is to hover and fly until the battery is at a low voltage (about 15%), and then let it stand still for 2 hours before flying and testing again. During the test, we found that the battery power jumped to 0. Later, we found that after standing still at a low voltage and then discharging, the end voltage would drop faster than during non-stop flight. I suspect it's because the temperature got lower and the internal resistance of the battery got larger. Because compared to during flight, the temperature dropped by 20°C after standing still. So when discharging again, the voltage quickly dropped to the cut-off voltage, causing the 0 jump. Do you have any other variables or optimization methods that I should consider? Thanks.

  • Hello Ian,

    During the test, do you see the temperature reported from the gauge increase to larger than 40C? If so, then I would recommend using the GPCRB to optimize for the high temp. https://www.ti.com/tool/GPCRB

    Regards,

    Adrian

  • Hi,

    How to optimize high temperature with GPCRB tool? According to the introduction, it collects charging, discharging, and static data at room temperature and low temperature. Please provide the operating steps or documentation for optimizing high temperature. Thank you

  • Hello Ian,

    Here is the document for GPCRB: https://www.ti.com/lit/ug/sluubd0/sluubd0.pdf

    Regards,

    Adrian