This thread has been locked.

If you have a related question, please click the "Ask a related question" button in the top right corner. The newly created question will be automatically linked to this question.

TPS1HC30-Q1: I_load and I_out relationship

Part Number: TPS1HC30-Q1

Tool/software:

Hello,

I have a few questions like below.

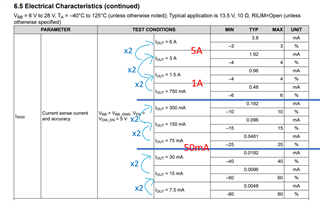
1. Is it  I_out = I_load in Datasheet ? Regarding the 6.5 Electrical Characteristics table , could I understand that there will be different Error% under different I_LOAD conditions?

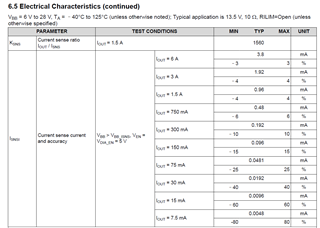
2. Will the Ksns (Current sense ratio) vary with different I_LOAD?

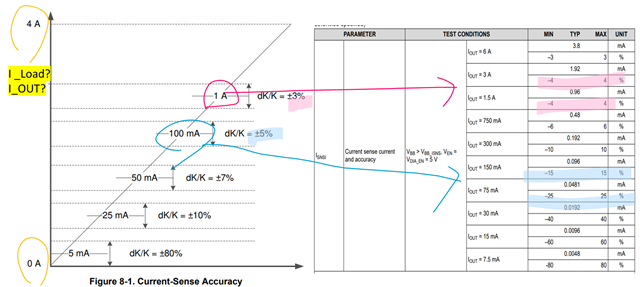
3. My  I_load conditions are 0.05A/1A/5A.The values provided in Figure 8-1 don't seem to match with Table 6.5. Based on my I_LOAD conditions, how can I determine the corresponding Error%?

Thank you!

Best Regards,

YuFang Chen

  • Hi Chen, 

    1.) Yes I_out = I_load here. Yes there are different current sense accuracies based on the I_load chosen. This is due to the nature of current mirrors. 

    2.) The K_SNS value is a constant. This does represent the ratio between I_out = 1.5 and I_SNS. The value is still applicable for different I_loads chosen since this is a ratio that is used in equations that take into account the I_load being used. For example, equation 1 in section "8.3.1 Accurate Current Sense" of the data sheet demonstrates how to select the correct R_SNS value accounting for the I_load chosen and using the K_SNS ratio constant. 

    3.) I understand the confusion here. The graph shown in Figure 8-1 is intended to demonstrate how the accuracy scales with load. The values given in the Current Sense Characteristics portion of the table should be used to help gauge the accuracy for a given I_load. 

    Thank you,

    Sarah

  • Dear Sarah,

    Thanks for your reply.

    3) I am performing WCA calculations.

    Should I primarily use the 6.5 table first? Based on my I_Load conditions, how should I refer to the Error%?

    Thank you!

    Yufang Chen

  • Hi Chen, 

    Yes, please refer to the table in section 6.5. 

    I would suggest selecting the error closest to your chosen Iload. Or choose to work with the error value that give you a worst case condition. 

    Alternatively, you could plot the values as Figure 8-1 attempts to do to find a more precise match for your values. 

    Thanks,

    Sarah

  • Dear  Sarah,

    Sorry, I'm still a little confused.

    For example, with I_load = 50mA, according to Table 6.5, the error value between ±40% and ±25%. However, in Figure 8-1, the error for I_load = 50mA is shown as ±7%. Which error value should I refer to?

    Thank you!

    Best Regards,

    YuFang Chen

  • Hi Chen, 

    Please use the values in Table 6.5. Figure 8-1 is only for reference and does not have accurate values for device error. 

    Thank you,

    Sarah