This thread has been locked.

If you have a related question, please click the "Ask a related question" button in the top right corner. The newly created question will be automatically linked to this question.

TPS7A8101: How to interpret PSRR graphics ?

Part Number: TPS7A8101

Tool/software:

I 'm trying to understand the PSRR graphs present on page 8 of the TPS7A8101 DataSheet.
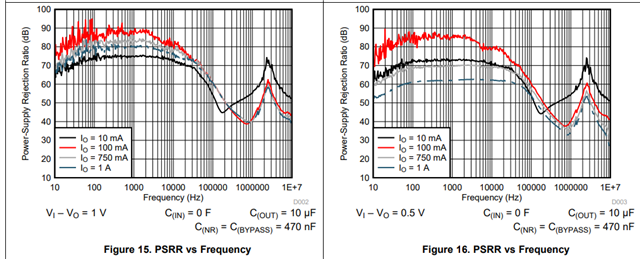
The graphs Figure 16 and Figure 18 show significantly different curves but I do not see which parameters change between the two graphs: the currents are the same as well as the values ​​of the capacitors and the dropout value.
Can you enlighten me on this problem?
Thanks in advance.

  • Hello,

    Thank you for your question.

    It seems like one thing that is different between some of the graphs is the headroom. For example, Vi - Vo=0.5, means that there is 500mV of headroom above the output, which changes the PSRR curves. Some of these graphs are also accompanied by a change in current across the different headrooms:

    Figures 17 and 18 have a typo in the conditions. Cout for Figures 17 and 18 should be 100uF.

    Figures 15 and 16 correctly state a Cout of 10uF. 

    Hope this helps to clarify this issue!

    Best,

    Hannah