This thread has been locked.

If you have a related question, please click the "Ask a related question" button in the top right corner. The newly created question will be automatically linked to this question.

LM51561H-Q1: setting up average model for sepic frequency response

Part Number: LM51561H-Q1
Other Parts Discussed in Thread: LM5156

Tool/software:

Hi team,

I am trying to understand the frequency response of a sepic designed using lm5156 with two methods:

method1: Using the quickstart calculator excel tool for LM5156, it gives a bode plot with option for varying input voltage but not with different load.

- I wanted to understand how reliable is this graph and also how to get it for different loads.

- The initial phase seen in that plot always starts from +90degrees at DC, which does not look correct or I might be missing something.

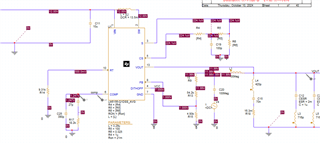
method2: Using the average pspice model of lm5156. The simulation setup downloaded from TI website seems to be set for a boost converter. I am not able to understand where to put the coupled inductors and coupling capacitor to set it up for a SEPIC circuit. It looks like the model has the output diode modelled inside it so it is not clear how it can be modified for sepic. 

I would appreciate if you could help understand both the above. Maybe some application note on using this if available?

Best regards,

Abhishek 

  • Hi Abhishek,

    Thanks for reaching out.
    The Graph in the calculation sheet gives you a good estimation on how the real bode plot look like.
    However, to see the reality, you have to go to the lab and do measurements.

    To see the plot for different loads, just adjust the load setting in the top of the calculator.

    Regarding the PSPICE model:

    The scheamtic can be set up like shown below:

    I am not sure what you mean with the diode is modeled inside.

    Best regards

    Moritz

  • Hi, 

    I am attaching an image of the average pspice model of LM5156.

    As you can see, it is not clear in this model how to setup the schematic of sepic using this. If you could help me with how to do it, that really helps.

    Best Regards,

    Abhishek

  • Hi Abhishek,

    I can comment on the PSpice question.
    Unfortunately, we only have a LM5156 average model for a Boost topology. The model is not intended for SEPIC and therefore will not return any usable results.
    As Moritz already mentioned, the most reliable method would be a measurement on a physical board.

    If the bode plot calculations from the quickstart tool look suspicious, you can double check by calculating the compensation by hand.
    We have application notes on this. Below is an example:
    https://www.ti.com/lit/an/snva168e/snva168e.pdf

    Best regards,
    Niklas