Tool/software:
Hi there,
I have used your inrush calculator for the fet I have chosen for my design, and I have a couple of questions.
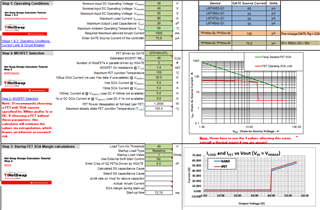
- In Step 2, is the SOA graph that the calculator produces purely for interest, or should I be aiming to get red line below green / green below red? I have presumed it is simply a copy of the SOA graph from the datasheet (in red) with the temperature derated version of the same based on the FET chosen in green and that as long as the numbers in the cells beside it (mainly the junction temp) are ok, the graph can be ignored?
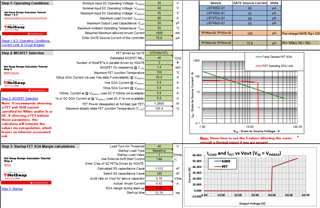
- One of the reasons for asking is that in Step 3, if I use soft-start control (with a resistive load) the graph is very different compared to without (the lines cross with SS, green is above red with no SS). But with SS I get a margin of only 0.35 which is cutting it a bit fine. Without SS I am getting a load line below the fet line which is better (but impacts the SOA graph and I am now worried about inrush to the fets).
So essentially I am a bit lost at how to interpret the graphs?
System is a relay and fuse replacement to switch power from charger to battery in an EV at 48V. I am using 3 pairs of back-to-back GT016N10TL's
Thanks!