Tool/software:
Hi,
I'm using a BQ27441-G1 fuel gauge in my application, and I'm having issues getting an accurate state-of-charge profile from it. In my application, I have a battery connected to a LED driver, with the user able to select different LED intensities (different driver currents). I'm using a 3088mAh battery that has a nominal voltage of 3.8V, max charge voltage of 4.35V, standard discharge current of 3000mA, and a max discharge current of 5000mA. The highest current draw the user can request is ~1500mA.
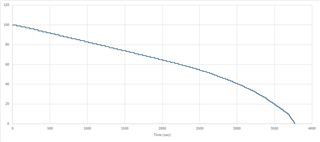
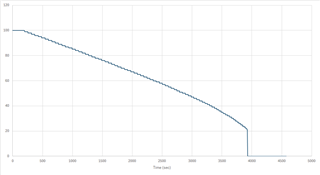
With this in mind, I've configured the fuel gauge with a design capacity of 3088, design energy of 11425 (design capacity * 3.7), taper rate of 153 (taper current is 202mA), and terminate voltage to 3.3V. What I see on the first discharge cycle seems reasonable, with a profile linearly decreasing, but with the rate of change increasing towards the end to 0%. This is acceptable, even through not ideal, since a linear slope would be better (see the profile in figure 1 below). The larger problem is that the second discharge cycle is a lot worse, with a sudden drop to 0% when the battery level reaches 20%.
Do you know what could cause this kind of problem? Could it be the parameters I've programmed are somehow wrong? The precise part number we're using is BQ27441DRZR-G1A. Could we need the G1B variant?
Also, when I monitor the battery voltage, the drop when we turn on the LEDs is different depending on the amount of current the user requests. I think this is expected, but how does the fuel gauge account for this. We have a LED driver that has a minimum voltage of 3V and shuts down below this. This is the reason I set the termination voltage to be 3.3V, so that we have a comfortable margin above this 3V limit. But if the battery voltage drop is dependent on the requested LED current, wouldn't the terminate capacity be at different points depending on this?
fig 1.

fig 2.


