This thread has been locked.

If you have a related question, please click the "Ask a related question" button in the top right corner. The newly created question will be automatically linked to this question.

BQ40Z50-R2: The RSOC accuracy is incorrect when the system is powered off in the non-full charge state

Part Number: BQ40Z50-R2
Other Parts Discussed in Thread: BQ40Z50, GPCCHEM, GPCRA0

Tool/software:

hi,

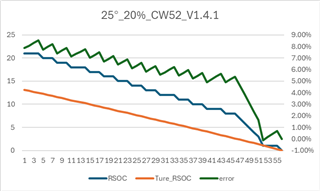
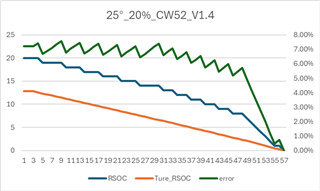
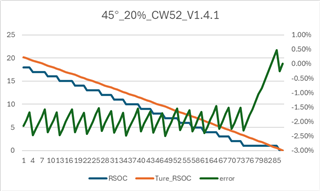
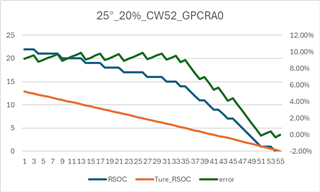
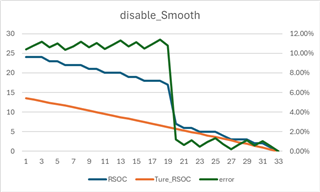
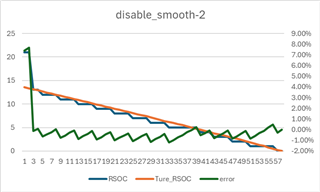
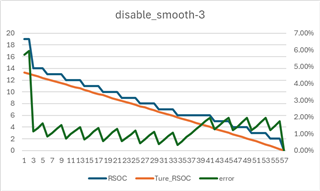
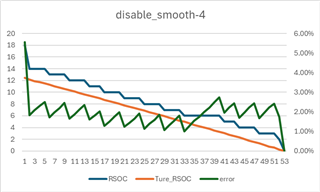
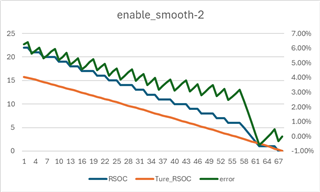
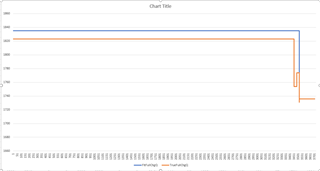
    I had a problem using the bq40z50-R4 for drone applications. The battery is a combination of 2S1P, the battery capacity is 1920mAh, and the typical discharge condition is 4C~5C. When the test battery starts discharging on full charge, the accuracy is acceptable, which meets our expectations, but the performance is poor when testing 20% and 50%. Can you help to see how to optimize the relevant parameters to improve the accuracy of non-full charge?

H03A_25deg_20%_CW52_V1.4_20241016.logH03A_0deg_20%_CW60_V1.4_20241017.logH03A_SBP_Gauge_bq40z50-R4_20240823_V1.4.gg.csv

  • Hi Xin,

    What is the expected terminate voltage here? I see in the .gg file it is 6000mV, however this is being discharged past until the CUV protection turns off the FET. Is there a difference in what this value is set to in the sent .gg file and the test?

    Regards,

    Anthony

  • hi, Anthony,
    IT Gauging Configuration[CELL_TERM] = 1, so my termination voltage is the smallest cell voltage 2.8V. The log files were tested under the uploaded gg file configuration. According to Gauge's charge integral, it can be found that 20% of the battery's power displayed at the beginning of discharge can only release 240mAh, that is, 240/1920=12.5%. At the same time, it can be found that RSOC does not rapidly converge to a reasonable error value (3%@25℃). Is there any way to optimize?

  • Hi Xin,

    Understood, thank you for clarifying. How long is the cell relaxed before starting these low RSOC discharge tests? Is there enough time for the gauge to preform OCV measurements?

    Also, how was the ChemID chosen for this application? Was the GPCCHEM tool used?

    Regards,

    Anthony

  • hi, Anthony:
    1. During the normal temperature test, the battery will be put in a Relax state for 2h after being charged; during the low temperature test, the battery will be charged at normal temperature, then Relax for 1h, and then adjust the temperature to enter the low temperature environment for 1.5h.
    2.the chemical id is customized.

  • Hello,

    This week is a holiday in America, we will get back to you next week.

    Regards,

    TI BGP Team

  • Hi Xin,

    1. During the normal temperature test, the battery will be put in a Relax state for 2h after being charged; during the low temperature test, the battery will be charged at normal temperature, then Relax for 1h, and then adjust the temperature to enter the low temperature environment for 1.5h.
    2.the chemical id is customized.

    Thank you for confirming these. Please ensure while in rest that a Qmax update is able to be observed.

    Looking into the .gg file, I see that the Load Mode and Load Select are set to 1. Can you please tell us more about the application load since this could be affecting this movement in the SOC?

    Regards,

    Anthony

  • hi, Anthony:

    1.The Qmax is updated

    2.Our drone is close to the constant power discharge application scenario, and the typical hover condition is 52W constant power discharge, so the configuration of these two functions is 1.

  • Hi Xin,

    Since the typical hover condition is 52W, has a Load Select of 6 for User Rate with 52W as the set value been tested in this scenario?

    Regards,

    Anthony

  • hi, Anthony:

    I modified the relevant register configuration as you suggested. The accuracy of RSOC at room temperature is tested in the same way, and the experimental results show that the accuracy of RSOC starting discharge at 20% is not improved. The test log file and configuration GG file are attached.

    H03A_SBP_Gauge_bq40z50-R4_20241205_V1.4.1.gg.csv

    H03A_25deg_100%_CW52_V1.4.1_20241204.logH03A_25deg_20%_CW52_V1.4.1_20241205.log

  • Hi Xin,

    Thank you for sharing those files. It seems like once the charge is completed, the voltage at this point is within the OCV Flat Region for this chemID. This can be seen by the [OCVFR] bit becoming set in the relax period after the charge. When the relaxed voltage of the cell is within this range, the gauge will not update the Qmax value, which in turn could be affecting the SOC. We will look into where this is for this chemID.

    Regards,

    Anthony

  • hi, Anthony:

    We looked at 100% to 0% log data and found that SOC accuracy was ideal, with only 3% error.Further check whether the battery temperature is about 45℃ when the battery is discharged to 20%. Is it that a 45℃ model is used to estimate the remaining capacity when the 20%SOC is discharged at 25℃, resulting in a large error? According to this idea, I charged the battery at room temperature to 20% and let it stand for 1 hour, then adjusted the temperature of the incubator to 45℃ for 2 hours and discharged it under the same conditions. It can be found that the SOC accuracy of the coulometer can meet the requirement of 3% at this time. Want to know how to optimize this?

    H03A_45deg_20%_CW52_V1.4.1_20241206.log

  • Hi Xin,

    When operating at higher temperatures, the gauge will rely on the high temperature resistance values for calculation within the gauge. The heavier reliance on this resistance table might be assisting the gauge to create a more accurate SOC. If possible, please share the .srec programming file of the device after the 20% test at 25C and 45C so we can look into the internals of the gauge to see where the difference is coming from.

    Regards,

    Anthony

  • hi, Anthony:

    The attachments are.SREC after the RSOC is powered down at different temperatures. We look forward to your assistance in optimizing the accuracy in this non-fully charged state, so that our drones can execute relevant emergency strategies based on RSOC.

    20%SOC_Temp_Test.zip

  • Hi Xin,

    Thank you for sending the .srec, we will look in to the settings at this time. If possible, can you please use the GPCRA0 tool attached and share the results for us to compare?

    https://www.ti.com/tool/GPCRA0 

    Regards,

    Anthony

  • hi, Anthony:

    Do you see anything wrong with this.srec file? I used the GPCRA0 tool to upload the attached file according to the instructions, but the returned email indicated an error. Could you try using my file?

    H03A_GPCRA0.zip

  • Hi Xin,

    I was able to get the file through the tool. There is a set of RA Table values here that differ from the ones in use currently. If possible, can you please try running the 25 degree test again with these values?

    H03A_GPCRA0 (4)-report.zip

    Regards,

    Anthony

  • hi, Anthony:

    I tried to use the gg_out configuration file you provided to write into the battery in the same way to test, the result is still not ideal. Also ask your algorithm engineers to see if the log data can be simulated to locate the problem.

    H03A_GPCRA0_after_20241213.log

  • Hi Xin,

    Thank you for the update, we have began running simulations using the files sent. In the mean time, please try disabling the smoothing functionality ([SMOOTH] in the IT Gauging Configuration) to see if this is able to assist in the issue. Please also send the most updated version of the .srec as well.

    Regards,

    Anthony

  • As you guessed I will smooth this function disable, the test results show that the RSOC has a jump which is expected. The result of my test on that day was not particularly ideal. By observing the log data, I could find that the jump occurred at about 60s, but the retest the next day found that the jump was completed at 10s. Why the difference? PS: In the second test, the full discharge was carried out first, and the discharge power was 52W constant power.

    H03A_GPCRA0_update.zip

  • Hi Xin,

    I believe the gauge recalculated the values once the full discharge was completed before the next test was done. If consecutive cycles are ran after the full discharge has been done, does the error proceed to be the same?

    Regards,

    Anthony

  • hi, Anthony:

    First synchronize the test results:
    After this, I repeatedly tested the 20% RSOC 52W constant power discharge twice. From the test results, the error after removing the jump point is the same as 100% to 0%. Later, I turned on the [SMOOTH] function and tested it again, and the result was much better than the result after RA0. The error can converge to 5% in about 30s. We do not want to see the RSOC jump and we want it to remain smooth.
    A few more questions remain:
    1. When I look at the log data, I find that the parameters of Temp Ta and Tk are different. Will these two coefficients affect the estimation of RSOC? I would like to know the explanation of this.
    2. When I look at this log data, I find that there is a difference in the decline after the simulation update of the Ture FCC at the beginning of the discharge. What is the impact of this?
    3. Under disable Smooth function, I exported the modified GG file, and also exported the GG file after the second completion. You can compare these two GG files to see if you can find the difference.
    Finally add a state that we want:
    We hope to be able to converge the error to 5%@RT around 20s, and it will be smooth when RSOC jumps.

    H03A_update2_Test.zipH03A_SBP_Gauge_bq40z50-R4_20241205_V1.4.3.gg.csvH03A_SBP_Gauge_bq40z50-R4_20241218_V1.4.3.gg.csv

  • Hello,

    When I look at the log data, I find that the parameters of Temp Ta and Tk are different. Will these two coefficients affect the estimation of RSOC? I would like to know the explanation of this.

    Yes, these two parameters can effect the RSOC estimate. These values are used in the capacity simulation to predict how much the temperature within the cell will change.

    2. When I look at this log data, I find that there is a difference in the decline after the simulation update of the Ture FCC at the beginning of the discharge. What is the impact of this?

    There will be differences in the True FCC and the Filtered FCC value, however they typically will reach the same point as seen below. Disabling smoothing will use the True FCC and True RemCap values for the SOC, since they reach a similar value this should not impact as much. Whether smoothing is enabled or not, it is possible to see what each of these values will be seen below:

    We hope to be able to converge the error to 5%@RT around 20s, and it will be smooth when RSOC jumps.

    When you state that it needs to be smooth where the RSOC jumps, are you referring to the recovery in relax or is there another place where it is jumping?

    Regards,

    Anthony

  • The RSOC should not jump during the discharge process. When the algorithm triggers a large change after RM/FCC simulation, it is expected to smooth to the final value within a certain time (for example, 20s). That is, the [SMOOTH] function, can the smooth time be set?

  • Hello,

    I believe the only way to control the smoothing time is if the [DSG_0_SMOOTH_OK] function below is used:

    Regards,

    Anthony