Other Parts Discussed in Thread: GPCRB
Tool/software:
Hello forum.
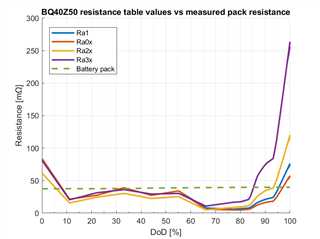
I recently performed a learning cycle on the BQ40Z50-R2 BMS where the battery pack resistances were updated. Besides the learning cycle, I performed a measurement of the battery pack resistance by using a BK Precision BA6010 Battery Analyzer and attached the Kelvin points to the negative and positive battery pack connections, thereffore not including the BMS. These two tests were done separately.
The result is as seen in the attached picture. I have read the https://www.ti.com/lit/an/slua450a/slua450a.pdf document for understanding whaat is going on with the resistance table values, but I still have a few questions related to this:
- What is the difference between e.g. Ra1 and Ra1x values?
- Where do I find the Rb temperature coefficient exponent used for converting the resistance values? As far as I understand, the resistance values I see in the table are normalized to 0°C.
I have attached the learning cycle log for reference.
The reason why Ra1, Ra0x, Ra2x, Ra3x were chosen is because these are tables I can see are used by the BMS.
Kind regards,
Victor