This thread has been locked.

If you have a related question, please click the "Ask a related question" button in the top right corner. The newly created question will be automatically linked to this question.

TPS7H4104-SEP: Control Loop Bode Plot Measurement Data

Part Number: TPS7H4104-SEP

Tool/software:

Hello, 

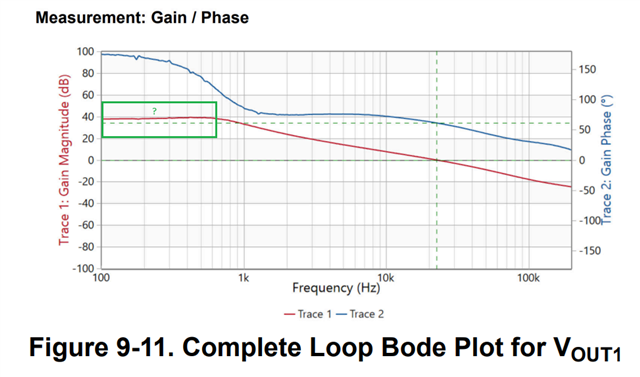
I was wondering if you could explain the phenomenon of this flat line on the total loop measurement. Typically for a compensated current-mode regulator, we have roughly a straight line but the plot in the datasheet shows that there's a flat line on the magnitude below 1kHz. 

Could you please explain why this is the case?

  • Hi Nabil,

    Current-mode regulators do not inherently have a pole a 0Hz, so depending on the configuration of the converter that pole can be seen at higher frequencies like in the above plot. Sometimes this pole is at a very low frequency, so the plot looks like it has a constant slope from the very beginning. If that pole is at a high enough frequency, then the flat part of the gain curve will be visible on the plot.

    "Understanding and Applying Current-Mode Control Theory" is a great document that also contains the transfer functions of various current mode converter topologies if you are interested in learning more.

    Thanks,

    Andy