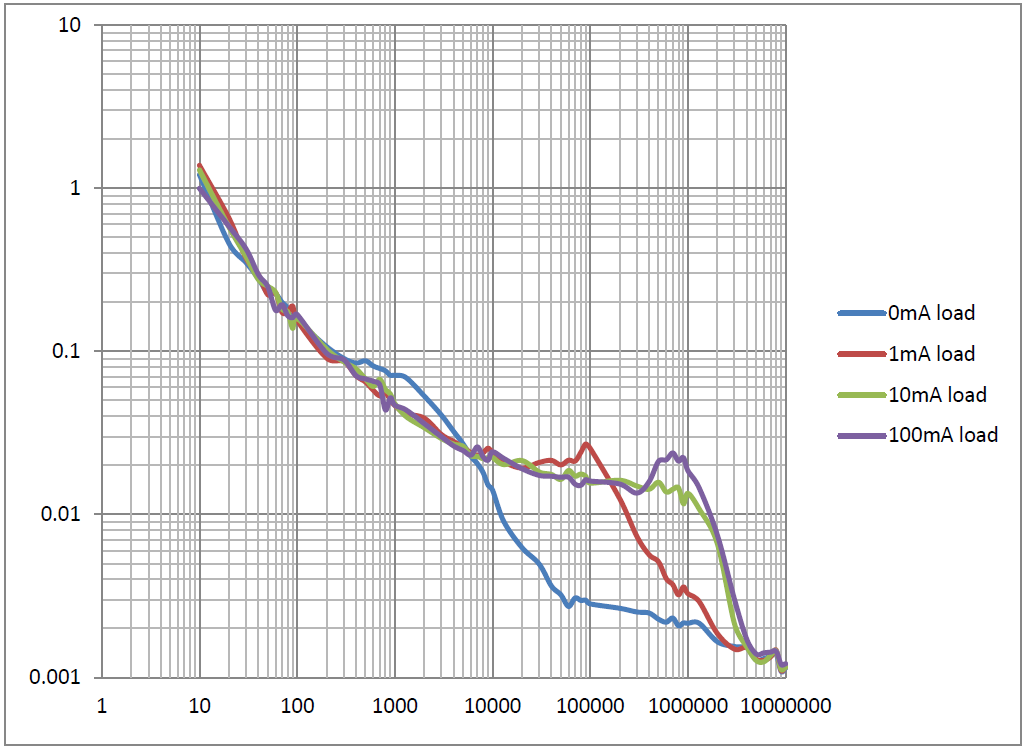
Looks like a nice part. The X-Axis on figure 13 seems to be incorrect as the interval between the major vertical gridlines would usually follow the powers of ten. (i.e. 1,10,100, 1000 etc.)

-
Ask a related question
What is a related question?A related question is a question created from another question. When the related question is created, it will be automatically linked to the original question.