


Hi,
We intend using the UCC28070 in a SMPS application and are using the UCC28070EVM to test and develop our product.
One of the tests we did was to verify the PFC PWM signals and the PFC operation. What we found was unexpected.
We expected to find the PWM duty cycle varying slowly over a number of cycles, and that the PWM duty cycle could be directly correlated to the input AC voltage.
The duty cycle we observed was inconsistent with our expectations in that it contained wide excursions each half cycle of the AC mains.
The test was a very simple test - connect a resistive load (660 ohms) to the EVM and measure the PWM duty cycle for a nominal 110VAC (50Hz) and 240VAC (50Hz) after PSU was stable after power on.
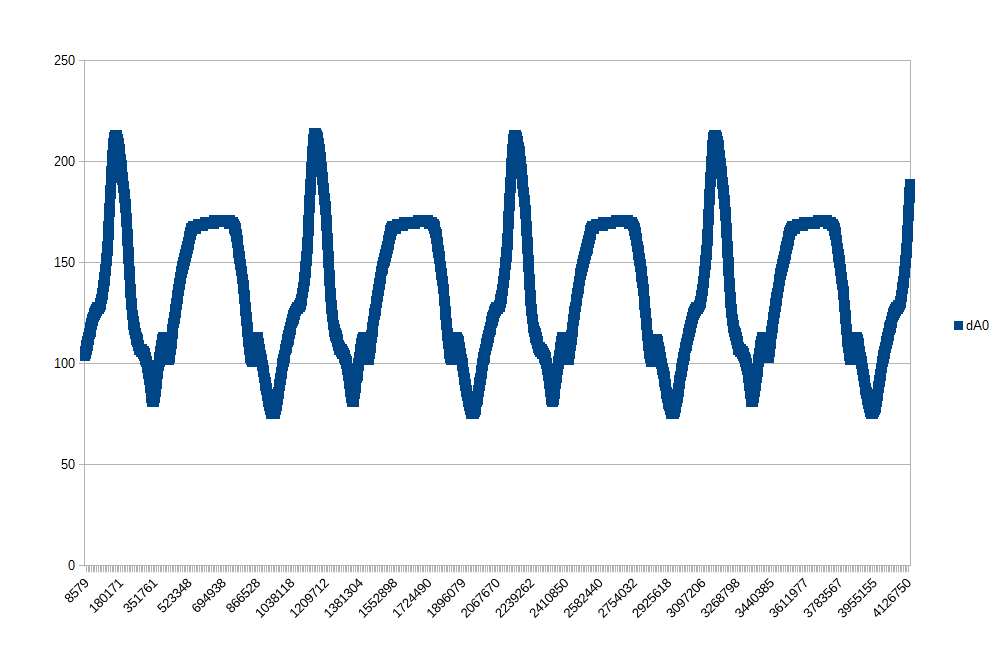
A 100MHz logic analyzer was used to capture gate switching of the IRFB11N50A inductor FETs Q1, Q2. Both gate signals were captured to confirm duty cycle data. The data capacity of the analyzer allowed the capture of the waveform over 1.5 AC 50Hz cycles. The PWM period was observed to be constant at approx 200KHz (505 * 10nS), giving nearly 2000 PWM periods per half AC cycle.
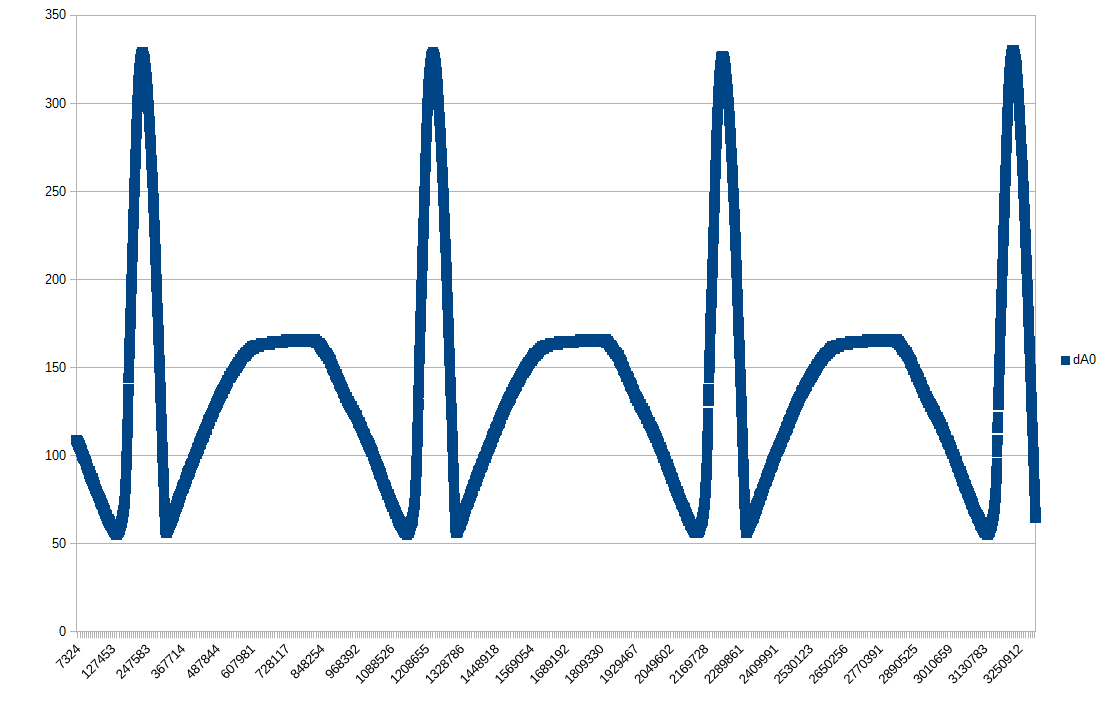
To make sense of the data, the data was plotted, with the results resembling the shape of a Viking Helmet. The 110VAC plot appears much 'cleaner' than the 240VAC plot, in that there is a short 'reversal' in the duty cycle appearing twice each cycle in the 240VAC plot.
Attached are 2 plots, one for 110VAC 50Hz 660 ohm load, one for 240VAC 50Hz 660 ohm load. The scale units are in the 10nS units of the logic analyzer capture.
The X axis is time from trigger, while the Y axis is the PWM pulse width (duty cycle) for the Q1 gate.
We don't understand the waveform we captured.
a. We expected an essentially constant PWM duty cycle since the load is resistive and constant.
b. We expected the PWM duty cycle to vary slowly, if it did so, over 10 AC cycles, not dramatically several times per half cycle.
c. We expected the PWM duty cycle to directly reflect the input AC voltage, which could be presumed to be constant over a 2 cycle AC period.
Help requested:
We need to understand WHY we are getting these waveforms. Our expectations are based on our previous designs (which are smaller, being 120W and less). Could you please assist us so that we can go forward with our design.
Hi,
We intend using the UCC28070 in a SMPS application and are using the UCC28070EVM to test and develop our product.
One of the tests we did was to verify the PFC PWM signals and the PFC operation. What we found was unexpected.
We expected to find the PWM duty cycle varying slowly over a number of cycles, and that the PWM duty cycle could be directly correlated to the input AC voltage.
The duty cycle we observed was inconsistent with our expectations in that it contained wide excursions each half cycle of the AC mains.
The test was a very simple test - connect a resistive load (660 ohms) to the EVM and measure the PWM duty cycle for a nominal 110VAC (50Hz) and 240VAC (50Hz) after PSU was stable after power on.
A 100MHz logic analyzer was used to capture gate switching of the IRFB11N50A inductor FETs Q1, Q2. Both gate signals were captured to confirm duty cycle data. The data capacity of the analyzer allowed the capture of the waveform over 1.5 AC 50Hz cycles. The PWM period was observed to be constant at approx 200KHz (505 * 10nS), giving nearly 2000 PWM periods per half AC cycle.
To make sense of the data, the data was plotted, with the results resembling the shape of a Viking Helmet. The 110VAC plot appears much 'cleaner' than the 240VAC plot, in that there is a short 'reversal' in the duty cycle appearing twice each cycle in the 240VAC plot.
Attached are 2 plots, first is 110VAC 50Hz 660 ohm load, second is 240VAC 50Hz 660 ohm load. The scale units are in the 10nS units of the logic analyzer capture. Note 110VAC PWM excursion is to 3.5/5uS, while the 240VAC excursion is only 2.13/5uS.
The X axis is time from trigger, while the Y axis is the PWM pulse width (duty cycle) for the Q1 gate.
We don't understand the waveform we captured.
a. We expected an essentially constant PWM duty cycle since the load is resistive and constant.
b. We expected the PWM duty cycle to vary slowly, if it did so, over 10 AC cycles, not dramatically several times per half cycle.
c. We expected the PWM duty cycle to directly reflect the input AC voltage, which could be presumed to be constant over a 2 cycle AC period.
Help requested:
We need to understand WHY we are getting these waveforms. Our expectations are based on our previous designs (which are smaller, being 120W and less). Could you please assist us so that we can go forward with our design.


