

I calculated synchronous buck transfer function Bode plot drawn as follows , with reference to "switching converter dynamic performance", and the use of SFRA ti Potter result is as follows:
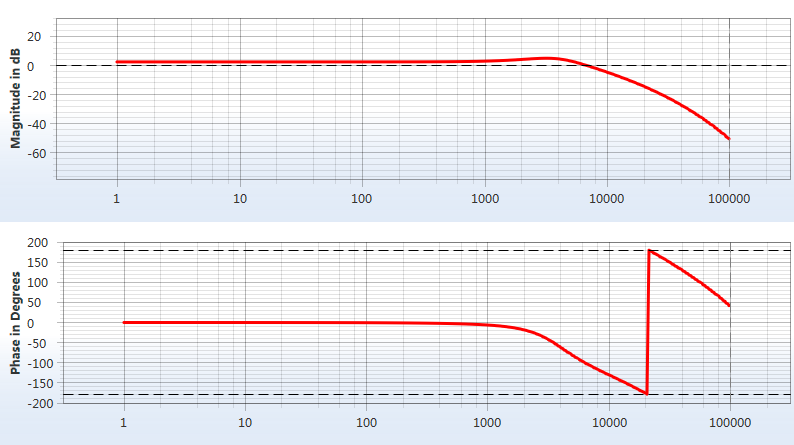 I ask why is there such a big difference ? SFRA results Why have a 360 ° phase mutation it

-
Ask a related question
What is a related question?A related question is a question created from another question. When the related question is created, it will be automatically linked to the original question.
