This thread has been locked.

If you have a related question, please click the "Ask a related question" button in the top right corner. The newly created question will be automatically linked to this question.

ucc28880EVM high side buck converter efficiency

Other Parts Discussed in Thread: UCC28880

Team,

i have a simple question about the efficiency graph.

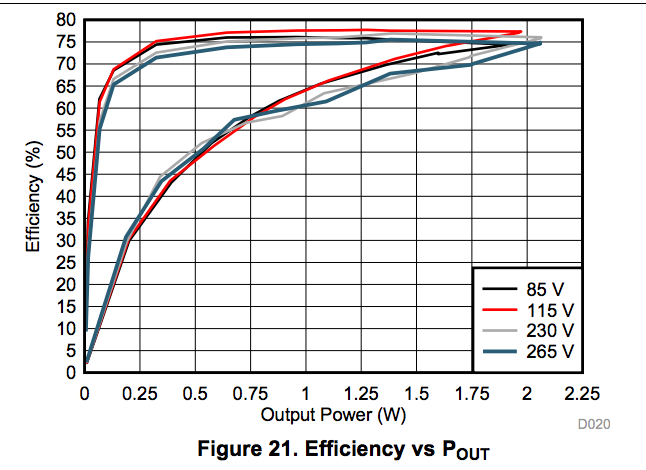
why their have two kinds of efficiency ? 

what is the meaning between the two efficiency line ?  

for example, when the output power is 1W, there are two kinds of efficiency.

  • This is what's happening:

    As the load is increased from no load to a max load (about 2W), the UCC28880 is in constant voltage mode and
    the efficiency profile follows the upper section curves.
    If you attempt to go beyond the max load point, the output voltage drops and the UCC28880 goes into current limit.
    The lower section of curves show the efficiency trajectory beyond the max load point.

    Regards,

    John Griffin

  • Peter,

    This curve shows the eff as load current is increased from near-zero, up to maximum load, and then subsequently as the load is increased into CC-mode (constant-current) overload territory. This is done by loading the output with a resistive load and then decreasing the resistance value to bring the power supply into CC-mode overload.

    In the CC-mode region, Vout is decreased in order to maintain near-constant output current, so the output power actually decreases in CC-mode. This is why the efficiency curve folds backwards in the plot. It's not 2 different eff plots, it's the same plot in 2 modes, with the 2 modes plotted together.

    The explanation is given earlier in the datasheet on page 21 for the low-side version:

    I hope this helps explain the shape of the curve.

    Thanks,

    Bernard