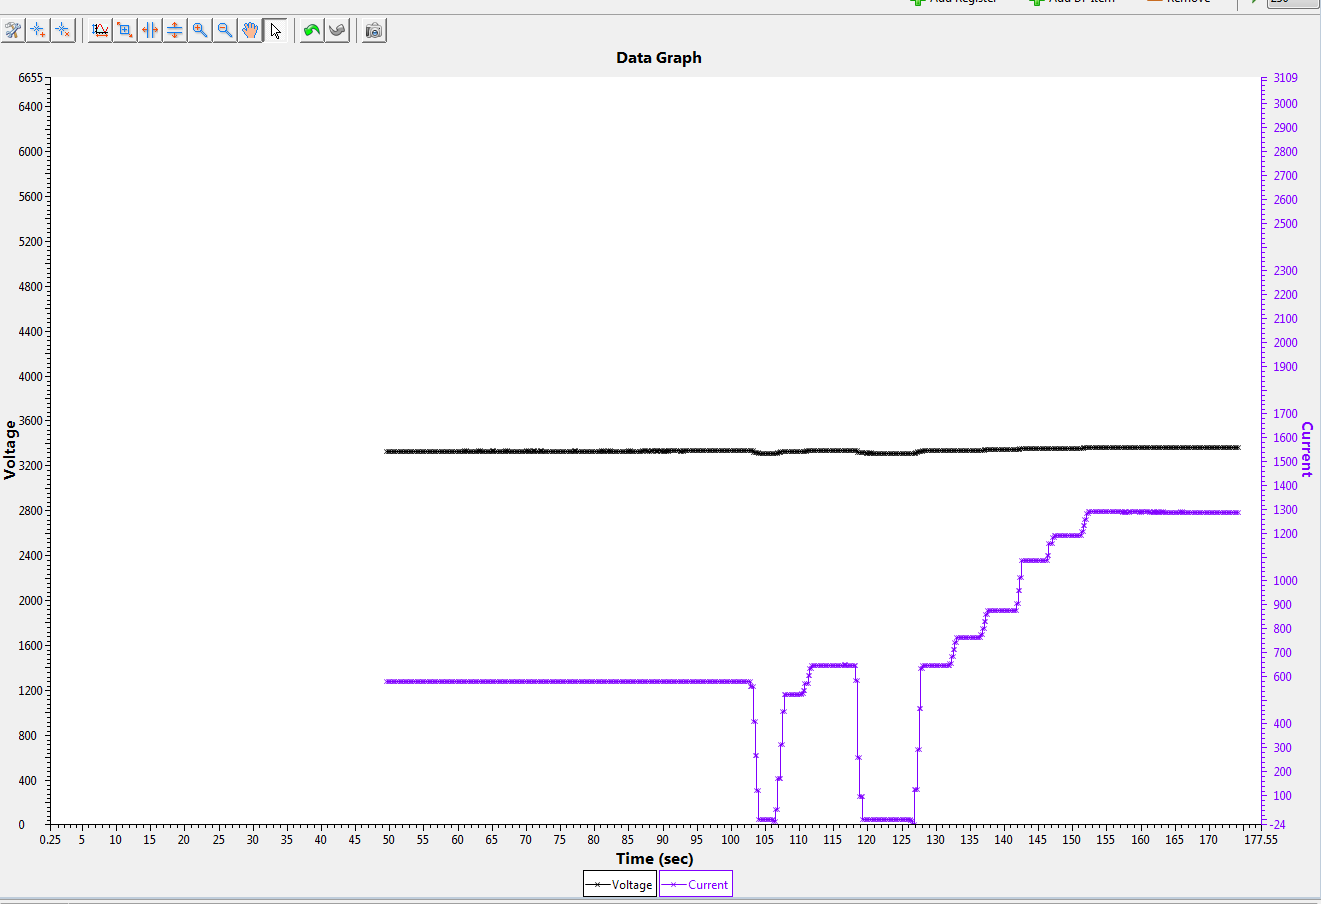
I am graphing the voltage and current of a bq40z50. After several hundred points being graphed in the "Data Graph" tab, the points on the left hand side start disappearing as new points are added on the right hand side.
I would like to graph an entire charge cycle. Is the Data Graph tab limited in the number of points it can display?