This thread has been locked.

If you have a related question, please click the "Ask a related question" button in the top right corner. The newly created question will be automatically linked to this question.

TPS65400: switching frequency equation and graph dont match

Part Number: TPS65400

Hi team,

In the datasheet there is an equation for calculating resultant switching frequency for given Rosc, and then there is a ncie graph. The problem is they do not match.

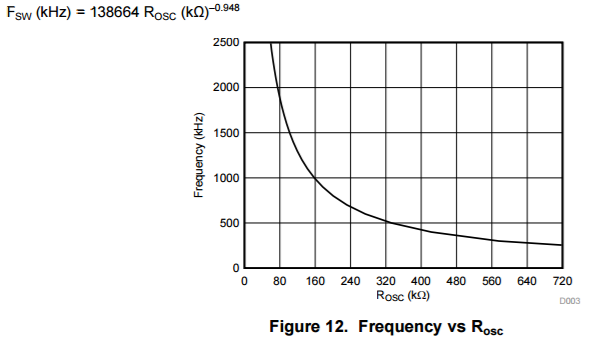
Plug in 160 for Rosc and you get 1128kHz, more than 10% off from the graph. Why is this the case, and can you recommend the more reliable approach of the two?

If my customer wants a very specific switching frequency, are they just going to have to guess and check until they nail it?

Thanks,

Brian

  • Hi, Brian

    The figure 12 is the curve fitting of just one EVM board test result.

    The Fsw formula is optimized according to several EVM board test.

    So the figure 12 is not matched with formula calculation.

    So if need specific Fsw, recommend to use Fsw formula to calculate Rosc.

    I also double check on EVM, for your reference.

     When Rosc=160kohm, the Fsw=1.07MHz, because of mass production variation, the value is in normal range compared to 1.128MHz.