This thread has been locked.

If you have a related question, please click the "Ask a related question" button in the top right corner. The newly created question will be automatically linked to this question.

tps53625 Loop Stability test

Other Parts Discussed in Thread: TPS54625, TPS53625

Hi

I use TPS54625 for my VRM to x86 CPU.  I want to make loop statility test on tps53625. There is some info on page 37 of the datasheet about the control loop, but the test point about the loop stability test is not mentioned. Just like the figure blew.

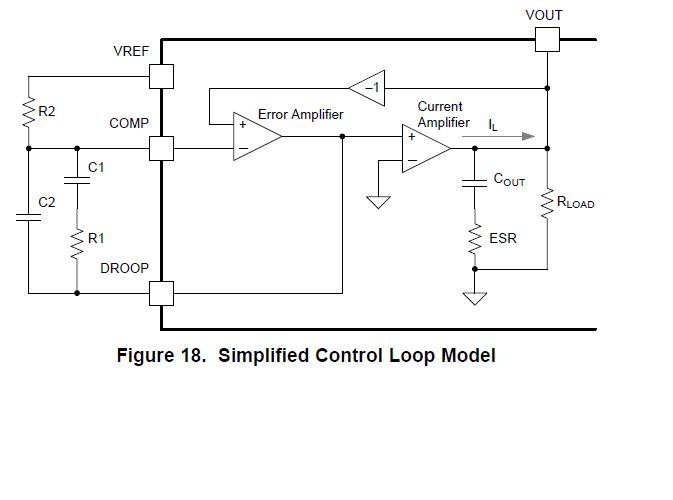
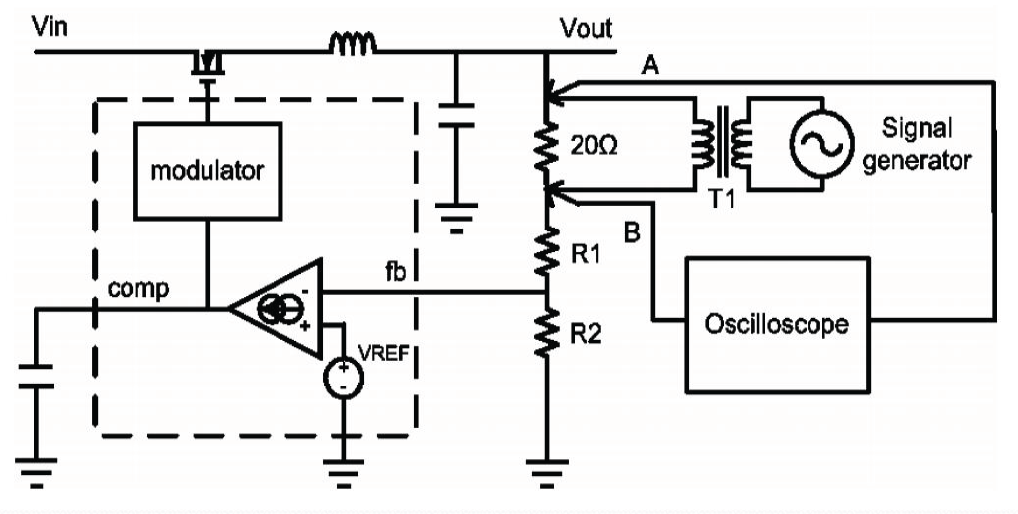
I want to know if I make loop stability test on tps54625, then my Signal Stimulus should be injected to where?  As we know the test equipment usually have  3 probes (the signal stimulus, the input signal detect, the output detect signal)  like the diagram blew.

Thanks!

  • Hello,

    To take a bode plot measurement on the TPS53625 you would use the same procedure as the TPS54625. The figure from the 625 datasheet is simplified to show a model the control loop and not necessarily all the test hooks for a measurement. 

    From the application schematic on page 31 you would use R12 (or your equivalent part number) populated with the 20Ω resistor as the injection point. Then your probes go on either side of the resistor to measure the input and output to your perturbations.

    Please let me know if you have any other questions.

    Cheers,

    Carmen


  • Hi

    I have tested the loop stability on R12. the test result is blew。 it looks like the Figure 20 on page 40 of datasheet。 but  as we know the when the Phase line touches the 0, we can get the Gain Margin.

    Actually, the Phase line didn't  touched  0  in the picture blew, neither did it in Figure 20 of datasheet。  Is this result pass?(both Phase Margin and Gain Margin).  If not  how can I modify the RC paramter to fix it.

  • Hello,

    The bode plot you took is definitely a valid result even though Phase doesn't cross 0 degrees over the frequency range you measured. With 45 degrees of phase margin your design can be considered stable as well but should you need to push it higher feel free to send a schematic along and I can review it for you.

    You can see a similar curve in the TIDA-01512 Design Guide using a different multiphase controller. The bode plot in Figure 20 has infinite gain margin for the frequency range of interest and the plot in Figure 21 has 19db of margin. Both can be considered stable designs.

    Cheers,

    Carmen 

  • Hi

    I attch the power schematic. you can see it.  

    Thanks.vccsram.pdf

  • Hello,

    If your design is working and meeting all the Intel specs then there's no reason to start changing components. The desgins looks pretty solid. However, as an experiment you can try playing with the values of C391 (dropping to ~100pF) and R229 (increasing to ~4.99kΩ) and seeing how that affects your phase margin. 

    Thanks,

    Carmen