On september 2017 data sheet pages 13-14 I read these formulas:

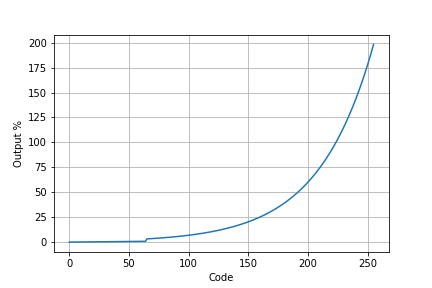
Assuming the graph is correct (and that makes sense), with a very quick approximation seems to be resulting from:
x <= 64: y = 0.0245 * x
x > 65: y = 0.3886 * exp( 0.0217 * x )
Supposed I'm not wrong, that "0.0217" is the only valid constant mentioned in the datasheet(...).
Can anyone confirm/verify this?
Thanks