A related question is a question created from another question. When the related question is created, it will be automatically linked to the original question.
If you have a related question, please click the "Ask a related question" button in the top right corner. The newly created question will be automatically linked to this question.
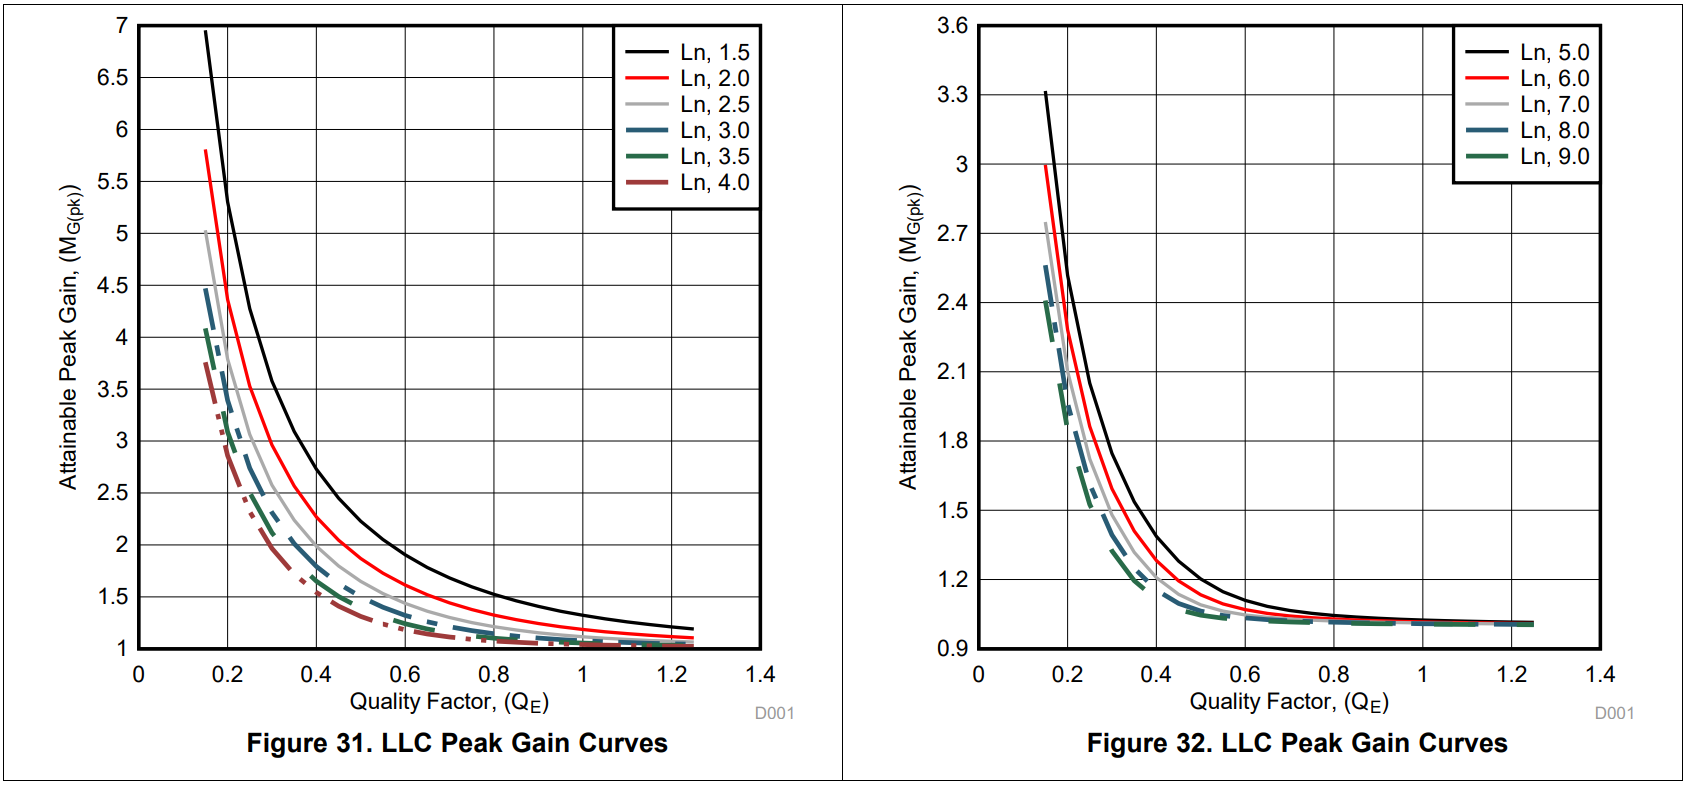
I see there is a graph for the MG(peak) VSQE, but doesn't tell the calculation process. Can you explain how to get this expression for MG(peak) and QE?
Mg is calculated in equation 23 in that document and this equation was used to generate the Peak Gain Curves - see P18 of the document. This calculation was done by iterating Eq23 to generate curves like those in Fig 6 and picking out the maximum value for each iteration.
Hope this answers your question - please feel free to re-post if anything is unclear.