Hello,
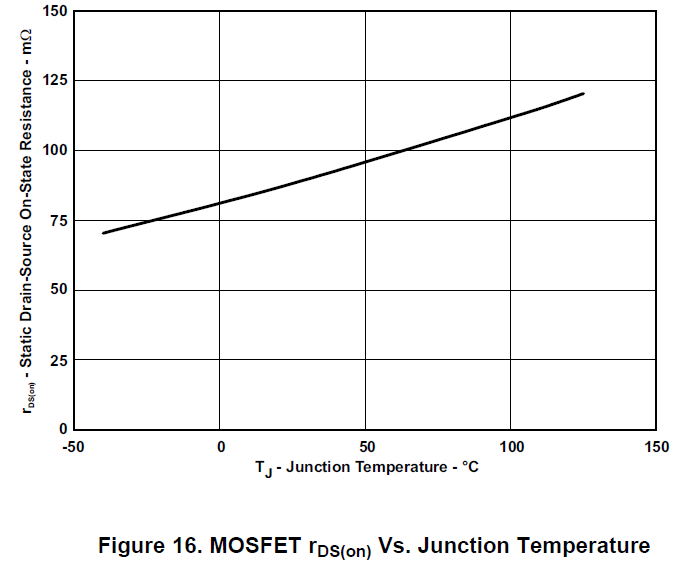
Had a query on how the output values varies with the variation in surrounding temperature.A characteristic curve or a tabulation will be helpful. The temperature will vary in the full operating range as recommended.
Hello,
Had a query on how the output values varies with the variation in surrounding temperature.A characteristic curve or a tabulation will be helpful. The temperature will vary in the full operating range as recommended.