This thread has been locked.

If you have a related question, please click the "Ask a related question" button in the top right corner. The newly created question will be automatically linked to this question.

WEBENCH® Tools/LM3150: Discrepenancy between WEBENCH and datasheet formula?

Part Number: LM3150

Tool/software: WEBENCH® Design Tools

Hi,

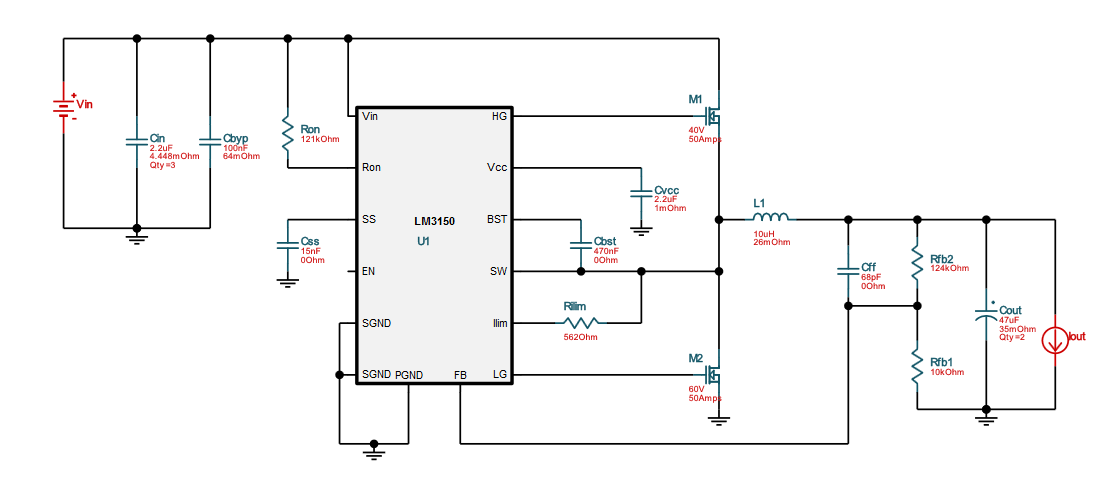
I am trying to create a design with the LM3150 that has Vin=24-28V and Vout=8V@3A.  WEBENCH will create a design for this just fine but when I try and validate it against the datasheet formula there seems to be som discrepancy. Specifically I use Equation 60 and 61 to calculate Ron using the selected switching frequency of fs=530e3

Rond=-(8-1)*(24*16.5+1000)-1000=-10777

Ron=(24*8-8)/(24*100e-12*530e3)-10777=134k

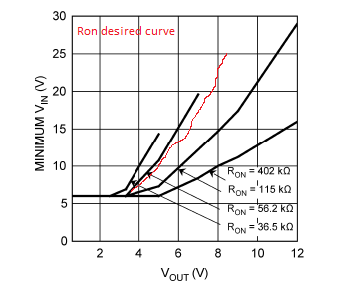
The value in the WEBENCH design is 127k, either way when looking at Figure 15, this does not seem to fit any of the curves shown there, even when interpolating the values. The nearest curve with Ron=115k, has Vout at about 11V for for an input of 24V.  Am I interpreting this figure correctly?

Also, the estimates for the minimum Cout and Cin are far greater the those given in the WEBENCH design.

I don't know whetjer to abandon this controller for this application or just believe the WEBENCH design, can someone help? Thanks.

Mike

  • Hi, Mike.

    Sorry for the confusion. Not often, but sometimes there can be some disconnect between the datasheet and webench models as design cores evolve.

    I would follow the datasheet over webench.

    Please do not extrapolate on the figures. This is probably not a best practice, but I understand where you are coming from.

    Please put in your best effort to input your schematic entry based on how you interpret the datasheet and I will review with you.

    Thank you.

  • Hey Marshall, thanks for the reply. this is the WEBENCH design:

    The figure in question is Figure 15, which I have reproduced below. The instructions are to calculate Ron and then check against Figure 15 to see if it will allow for the minimum desired input voltage. As you can see, the Ron=120k value is close to the Ron=115k which does not cross the Vin=24V, Vout=8V point. If I re-calculate Ron for a higher switching frequency, say 680kHz, I can get an Ron=110k, which falls between the Ron=56k and Ron=115k which might cross the Vin=24V, Vout=8V poing but its hard to say.

    The question is: How do I interpret this figure for Ron other then the ones listed to get the input-output I want.

    Here is what I think I want, but I don't know how this figure is created.

    Thanks.

  • I understand the problem, I believe.

    Webench calculated an RON that there is not a curve for in the datasheet, thus you cant validate that the webench and datasheet information correlate?

    I have some assumptions on the limiting factors for these curves, but first let me check-in with someone whom is more familarized with the part.

    Thank you.

    Can you please confirm my understanding of the question above ^.

  • Hi Marshall, that is correct, thanks.

  • I was just looking at the graph again, I think it indicates the lower possible value of Vin necessary to operate at the desired Vout for a given Ron, which for Ron=121k and Vout=8V is about 14V extrapolating the curves.  My minimum Vin=24V so I think this design will work.  I think this is correct but if you could confirm that it would be helpful.

  • I would start with the webench data. This information was most likely provided with validation data done in product design verification.