


Other Parts Discussed in Thread: TPS568215
Dear Sir,
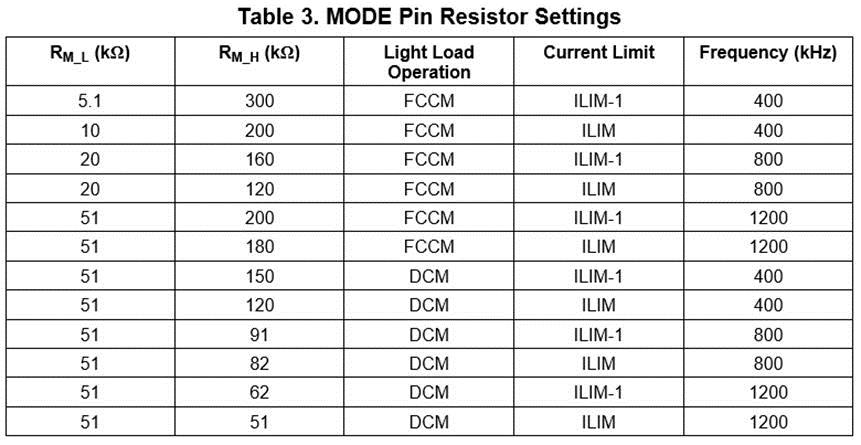
Our cusormer currently desgin TPS568215&TPS56C215 in thier project. and RD feedback that the Fsw is the not as accurate as the swtiching frequncey chart shown in the spec .please see as below. RD is asking if TI have the data of the tolerance of TPS568215&TPS56C215? or there is any caulation equation(or tool) to show the resonable fsw tolerance?Please kindly provide us if there is any data that we could expalin to RD about this.
Above, please kinldy hlep us with it and if there is any quesiton, please let us know
Cheers
Alec
