Hi
I finally managed to allocate much needed time to Transfer Functions and resolve my original post "UC3842 Transfer Function" in February 2020
The short answer to solving the problem using Plant Transfer function to plot Gain and Phase is substituting "s" with "jW".
These Transfer Functions are standard 2 Port systems with H(s) = Output/Input = Numerator(s) / Denominator(s) with the Numerator N(s) holding all the Zeros and the Denominator D(s) holding all the Poles
So by just looking at the Function we can clearly see how many poles and zeros are present.
For a Transfer function with single Pole H(s) = 1 / (1 + s/Wp) we have D(s) = 1 + s/Wp and substitute "s" with jW we get D(s) = 1 + j*W/Wp.
Now we substitute "j" with Sqrt(-1) so we solve by D(s) = Sqrt(1 + (W/Wp)^2)
Then H(s) = 1 / Sqrt(1 + (W/Wp)^2)
Note that we are using Radians not Frequency. so W = 2 * PI * Freq
and Wp = 2 * PI * FreqPole
If we look at the phase shift we have Theta = -ArcTan(W/Wp) so on the Pole we get lag of -45 degrees at Fcorner when W = Wp. This is exactly as we learned from a Text Book Integrator.
By using H(s) = 1 / Sqrt(1 + (W/Wp)^2) and setting W = Wp we get 1/Sqrt(2) and 20Log(1/Sqrt(2)) = -3dB. This proves the Transfer Function for a Pole has -45 Degrees at Fc-3dB.
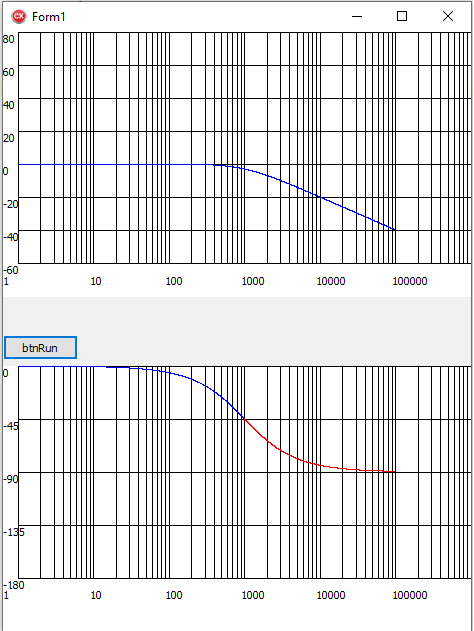
Below is a Single Pole Plot with Fc = 1kHz. We can see it crosses 1kHz at -3dB and the slope is -1 and Phase -45 Degrees. With -20dB/Decade we will cut the 10kHz and the 100kHz in a perfect -1 line as expected from theory.
For a Zero we will invert the Plot, so instead of going down by -1 we go up with +1 and Phase boost by +45 degrees.
By looking at the Mathematical form (1+ s/W) we can find them in our UC3842 Transfer Function as Poles and Zeros.
H(s) =Go * (1.0 + (s/Wesrz)) * (1.0 - (s/Wrhpz)) / (1.0 + (s / Wp1)) * (1 / (1.0 + (s/(Wp2 * Qp) + (Power(s,2)/ Power(Wp2,2)) ))); We can see this function is already in the correct form. So solve with same form as we did for the Single Pole.
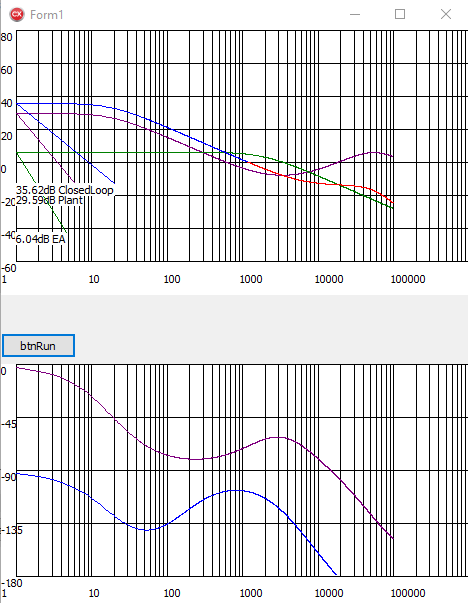
This results in the Plant, ErrorAmp and Closed Loop as the Picture below. To Plot the Closed Loop we simply multiply the OpenLoop with the ErrorAmp Function. From the plot we can now see the Closed Loop CrossOver Frequency just above 1kHz, "at the point where the ClosedLoop Gain Plot Blue and Red meet" with a nice flat -1 slope and ample Phase Margin with 12dB GainMargin, establishing a stable system. Always check the result with a VNA and test over entire input and load range, the EA Gain usually needs adjustment to set the CrossOver Frequency at the designed Frequency.
I hope this helps other designers make their own Bode Plots!! There are amazing Compensator Design Tools on the market, however writing your own will give you a much better understanding of this vast and complex field.
Regards and stay Healthy,
Werner.


