This thread has been locked.

If you have a related question, please click the "Ask a related question" button in the top right corner. The newly created question will be automatically linked to this question.

BQ51051B: Is this noise?

Part Number: BQ51051B
Other Parts Discussed in Thread: BQ51050B

I need voltage charging graphs. To do this I am measuring voltage from BAT pin while a battery is connected to it. 

The attached figures are the voltage graphs I measured.

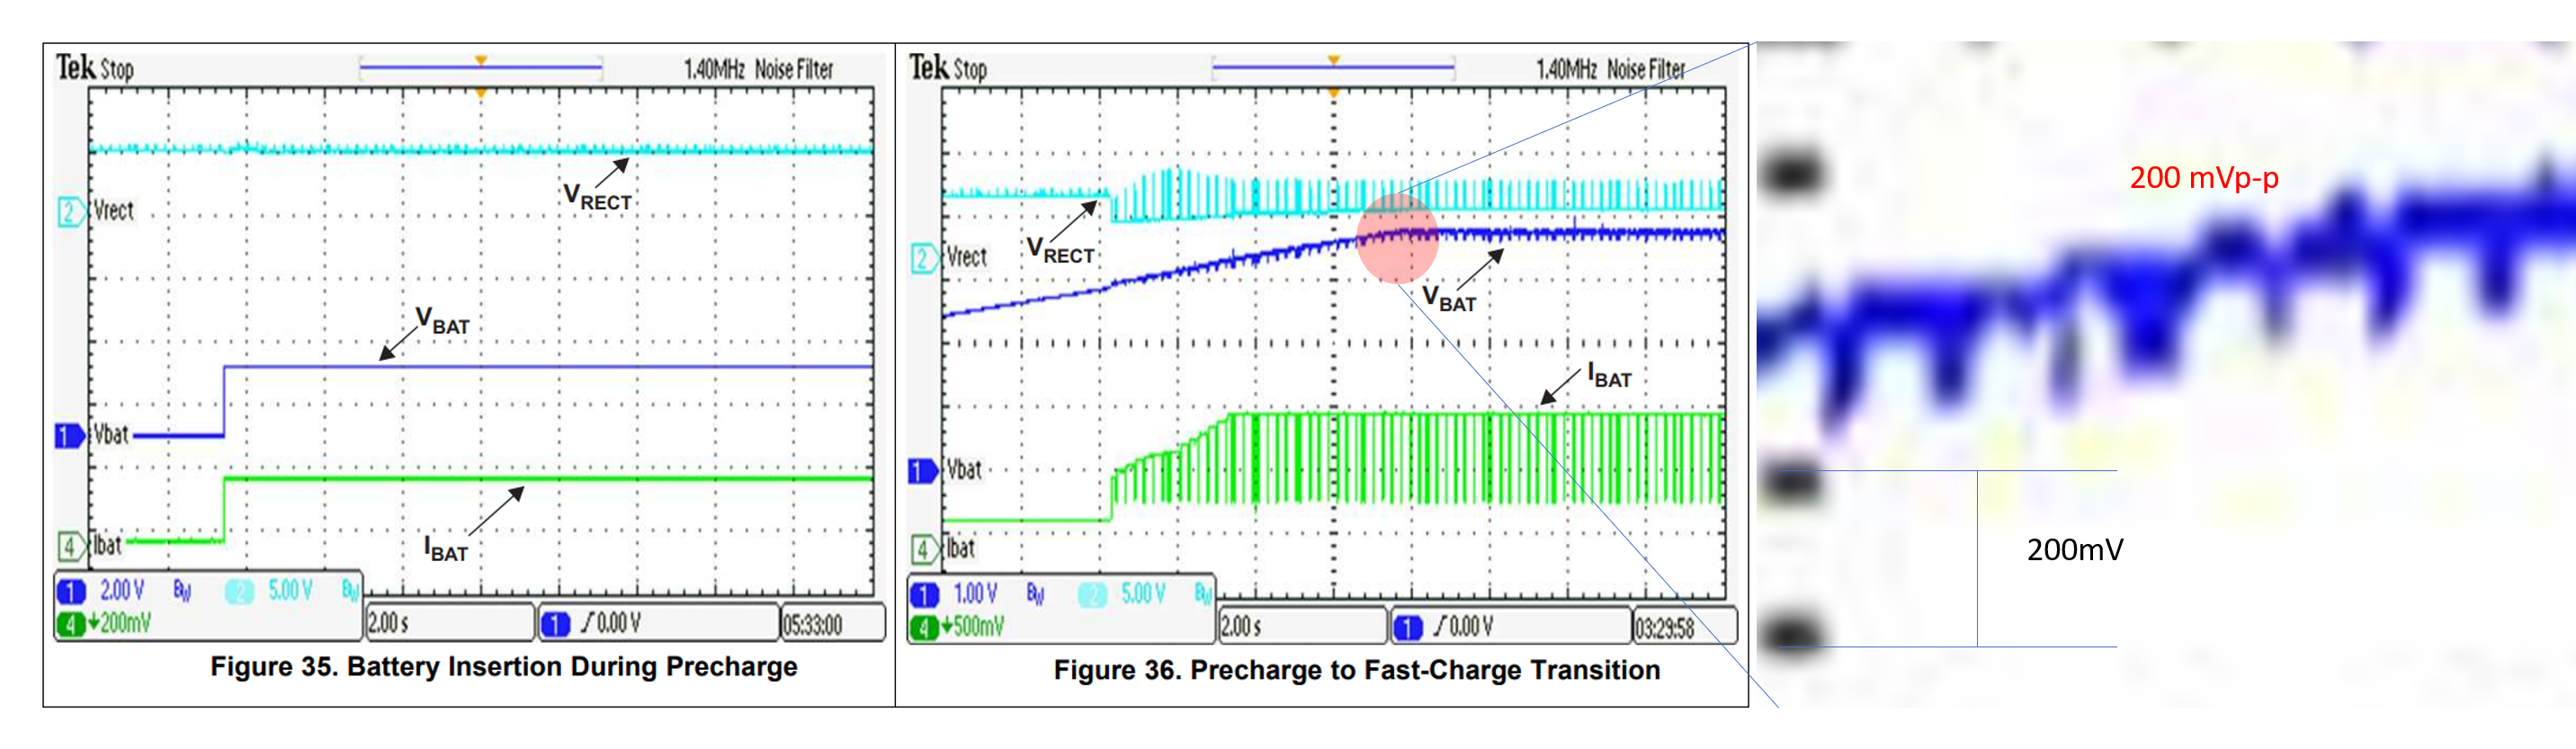
I would like to know about the spikes on the graphs.

To figure out what the spikes are, I read the datasheet.

Some figures in the datasheet showing BAT output were flat without spikes, but some had some spikes as I posted.

However, I was not able to figure out what the spikes are. The distance between peaks is not uniform. The distance between peaks is about 10 s.

Now, with my results, I have some questions.

1. What are these spikes? 

2. Where can I find some information about this? 

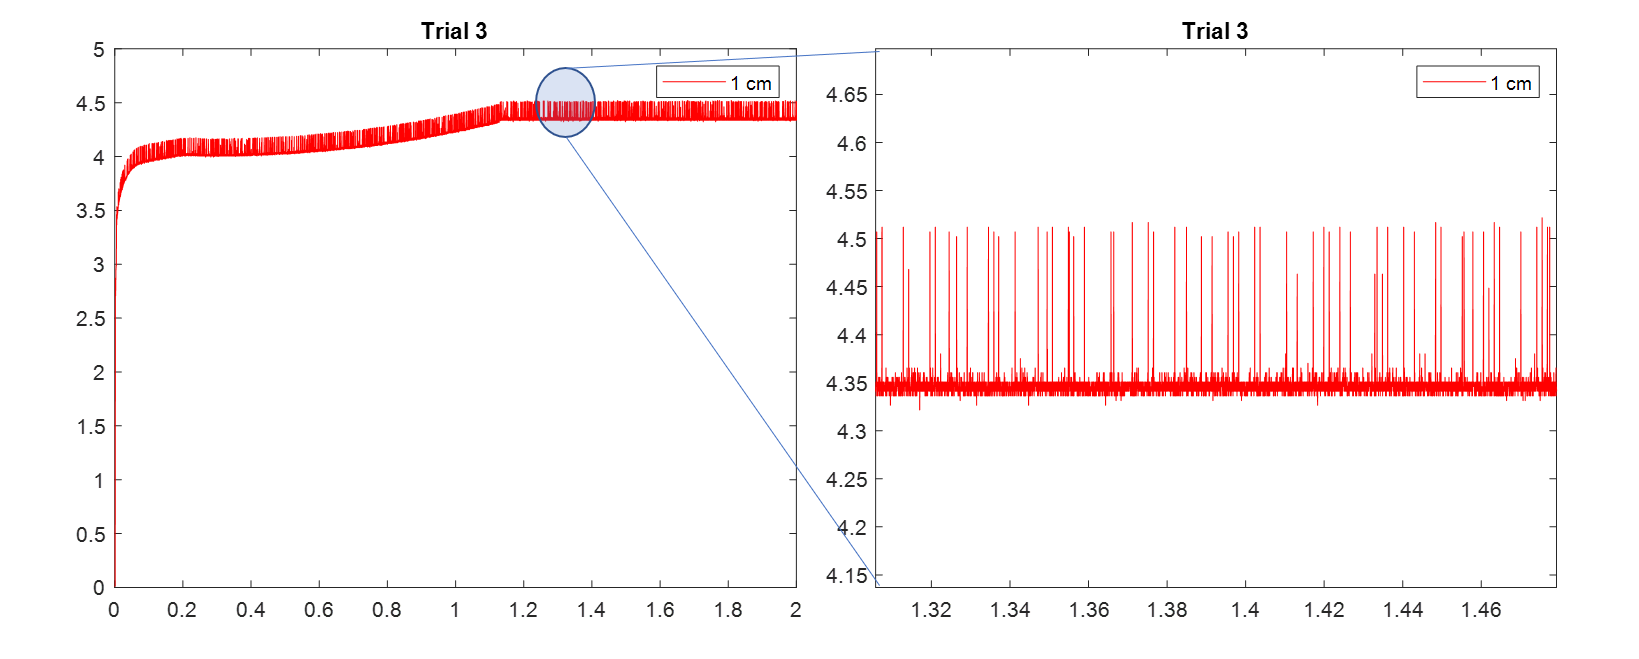
(x-axis: time(hour) y-axis:voltage)

Thanks,

  • Hello

    Thanks for the scope capture and information.  

    Increases in the voltage from 4.35V to 4.5V is not expected and has not been reported by other customers.  A decrease in the voltage due to communications packets is common.  Also increase in the voltage to this point should trip the battery protection circuit and disconnect the battery, have you seen this in your test.

    Is it possible the voltage spikes are noise associated with the ground?

  • Hello Bill,


    Thank you for your explanation. I don’t think this is caused by ground because when I measured a voltage with the same device from a power supplier I was not able to see that kind of noise. Anyway, I will try to measure the voltage with another device.


    While I was reading the datasheet, I have a question. Please see and explain the attached picture if possible. I captured this from BQ51051B datasheet. Contrary to figure 35, in figure 36, I was also able to see similar signals which I had. As you can see in the picture, the amplitude is almost the same as mine, 200 mV even though its frequency may be different.


    Could you also explain what I pointed in the picture?


    Thank you,


  • Hello

    1. What are these spikes?  --- Noise from communication Packets

    2. Where can I find some information about this? -- More explanation below, but also see section 8.3.4.9, figure 23 and section 8.3.3 in data sheet

    The spikes you are seeing are probably associated with the WPC communications packets that are sent every 250mS.  The BQ51050B will track battery voltage most of the charge cycle and noise filtering of the RECT signal is limited during this time, see section 8.3.3.  During Pre-Charge Phase and near Termination the device is not in track mode and noise filtering is much better.  See figure 23 in data sheet.

    To improve communications (reduce corruptions of serial data) the current is limited during comm time to 400mA.  The reduction in current will result in noise from serial data during this time and a drop in voltage, see section 8.3.4.9.

    In your Trial 3 graphs the noise is occurring at above a 10 sec rate.  This is probably due to a slower sample rate vs communications packets rate. 

    Additional filtering capacitors on OUT and RECT nodes will probably help.

  • Hello Bill,

    I really appreciate for the kind explanation. Thanks to you, I understand where the spikes came from.
    I will try both increasing sampling rates and adding a filtering cap.
    Could you recommend me the cap for the filtering?

    Thanks,
    Ahnsei Shon

  • Hi Ahnsei

    The RECT filter capacitors will have the greatest impact on the noise,.  Evaluation module will use 20uF, this is a typical value and it can be increased.  Also note that this node can be up to 15V during overload conditions.  But typical operation is below 7V.  

  • Hello Bill,

    Thank you for your answer!

    Have a nice day!!

    Best regards,

    Ahnsei Shon