Hello
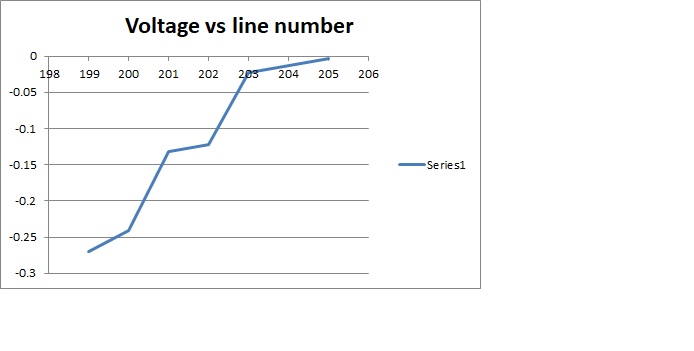
When running the IBISCHK on the UCD3138 IBIS model(https://www.ti.com/lit/zip/slum586, the following Notes are popped. Could you please help explain what these NOTES mean?
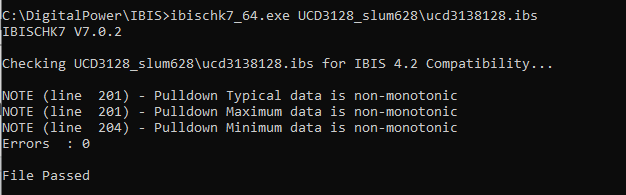
Thanks
Yihe
Hello
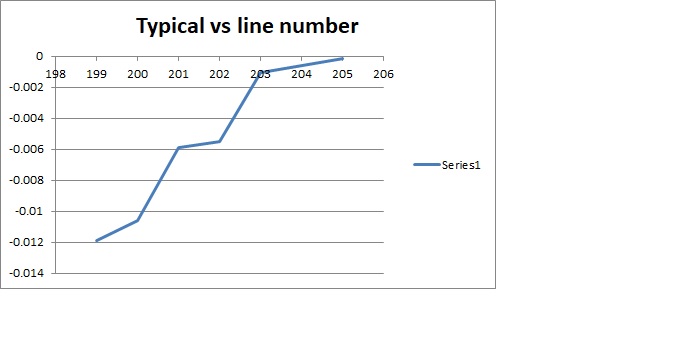
When running the IBISCHK on the UCD3138 IBIS model(https://www.ti.com/lit/zip/slum586, the following Notes are popped. Could you please help explain what these NOTES mean?
Thanks
Yihe