


Hi Team,
We can tune system frequency response by Spreadsheet, TPS54360-361FAMILY_CALC_TOOL_REVE though, but I'm not sure which part of the transfer function each GAIN line on the frequency response graph are for.
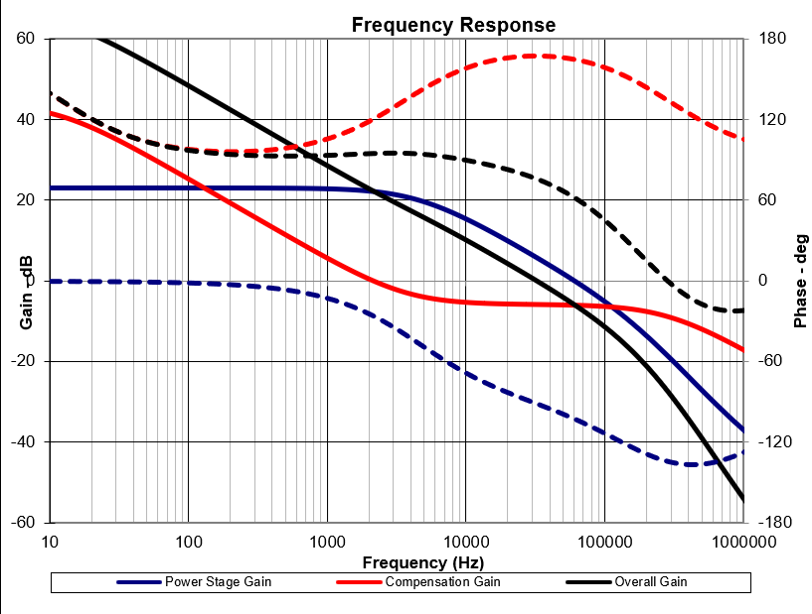
I can see three line on the graph as below. Could you please explain which part of the transfer function each line represents?
Power Stage Gain :
Compensation Gain :
Overall Gain :
Regards,
Takashi Onawa
