This thread has been locked.

If you have a related question, please click the "Ask a related question" button in the top right corner. The newly created question will be automatically linked to this question.

BQ34Z100-G1: SoC Drift and Discontinuities

Part Number: BQ34Z100-G1
Other Parts Discussed in Thread: BQ34Z100

Hello, I am working on a battery project and I am using a BQ34Z100 fuel gauge. My design uses a pack made of 6S 8000mAh cells.
My board uses a 1mOhm shunt, which is lower than recommended for this part, but is used for example in this application: www.ti.com/.../tidueg7b.pdf and is required for my current levels.

I've done the following so far:

Configured the parameters as described in the setup guide in section 8.2.2. In particular, I changed the following:
Design Capacity: I am using 4x current scaling, so my capacity is 2000mAh
Design Energy: My 4x current scaling gives 2000mAh * 3.6V * 6cells = 43200mWh, and I have scaled this by 10, so the actual value entered is 4320.
Number of Series Cells: 6
VOLSEL set to 1
Flash Update OK Cell Volt = 2400mV
Load Select: 3 (My application sometimes uses continuous slow rate discharge of about 1/8C or dynamic loading with avg of 2C, so the current average could be the best fit?)
Load Mode: 0
Cell Terminate Voltage: 3000mV
Taper Current: 100mA (400mA = C/20)
CC Threshold: 1800mAh (7200mAh = 90% of design cap)
Pack Configuration: 09d9
Pack Configuration B: af
Pack Configuration C: 37
FS Wait: 10 sec (I am looking to minimize quiescent current so I command the gauge to go to full sleep whenever battery is not plugged in)
QMax: 2070 (I set to 2000mAh at the start and I think this was updated automatically)
Deadband: 30 mAmp ( I raised this from the 5mA default because I think this was causing some problems with packs varying in SoC while sitting asleep, etc) I noticed the 13S reference design mentioned above set it to 15mA, and other posts recommend changing this to be higher for low value shunt R designs.

I also changed these to the value recommended by section 8.2.4 since my gauge is always attached to the battery
Max Res Factor 15
Min Res Factor 3
Max Res Scale 5000
Min Res Scale 200
Max QMAX Change 30

Chemistry is 2145, selected by using the GPCHEM tool and process, with a good match of 1.59% Max DOD Error %.

Other params I am thinking about changing are:
FC Set %: 100 Percent. I think I should change this to -1 to make it use the actual current taper as opposed to 100% SoC.
Design Resistance: 42mOhm default. Should I change this?

Load Select: was thinking about changing this back to 1 (default). How much does this matter?

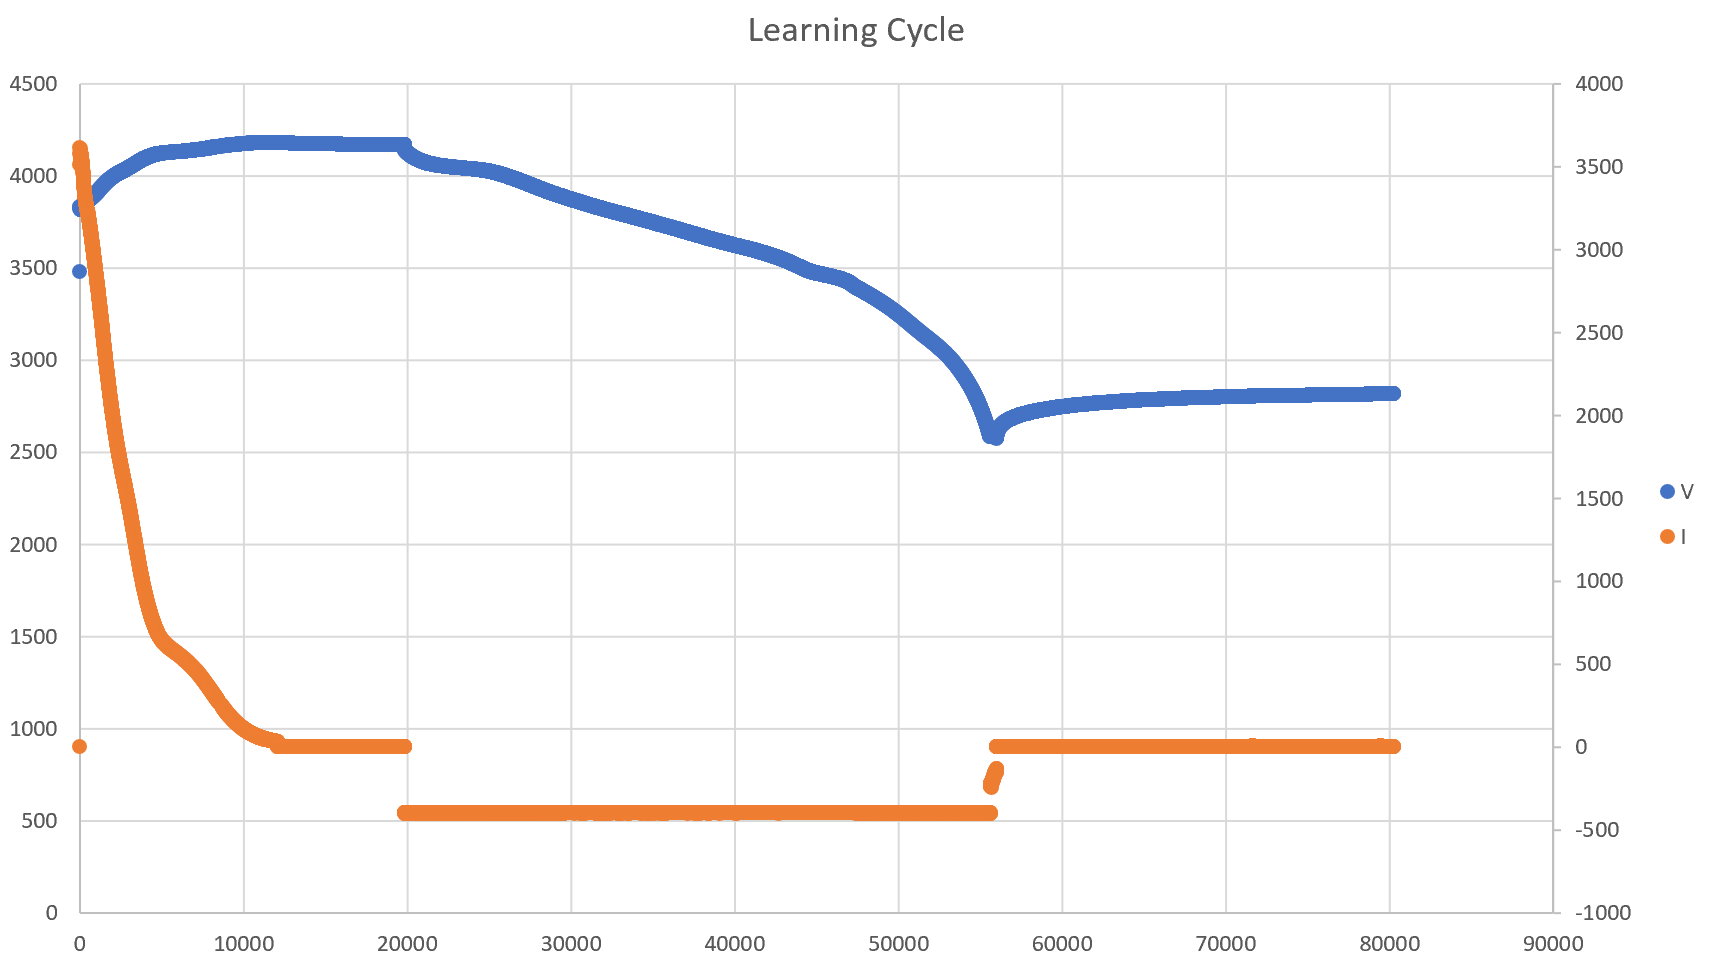
I then did a learning cycle, which finished properly and learned state 6 is achieved.

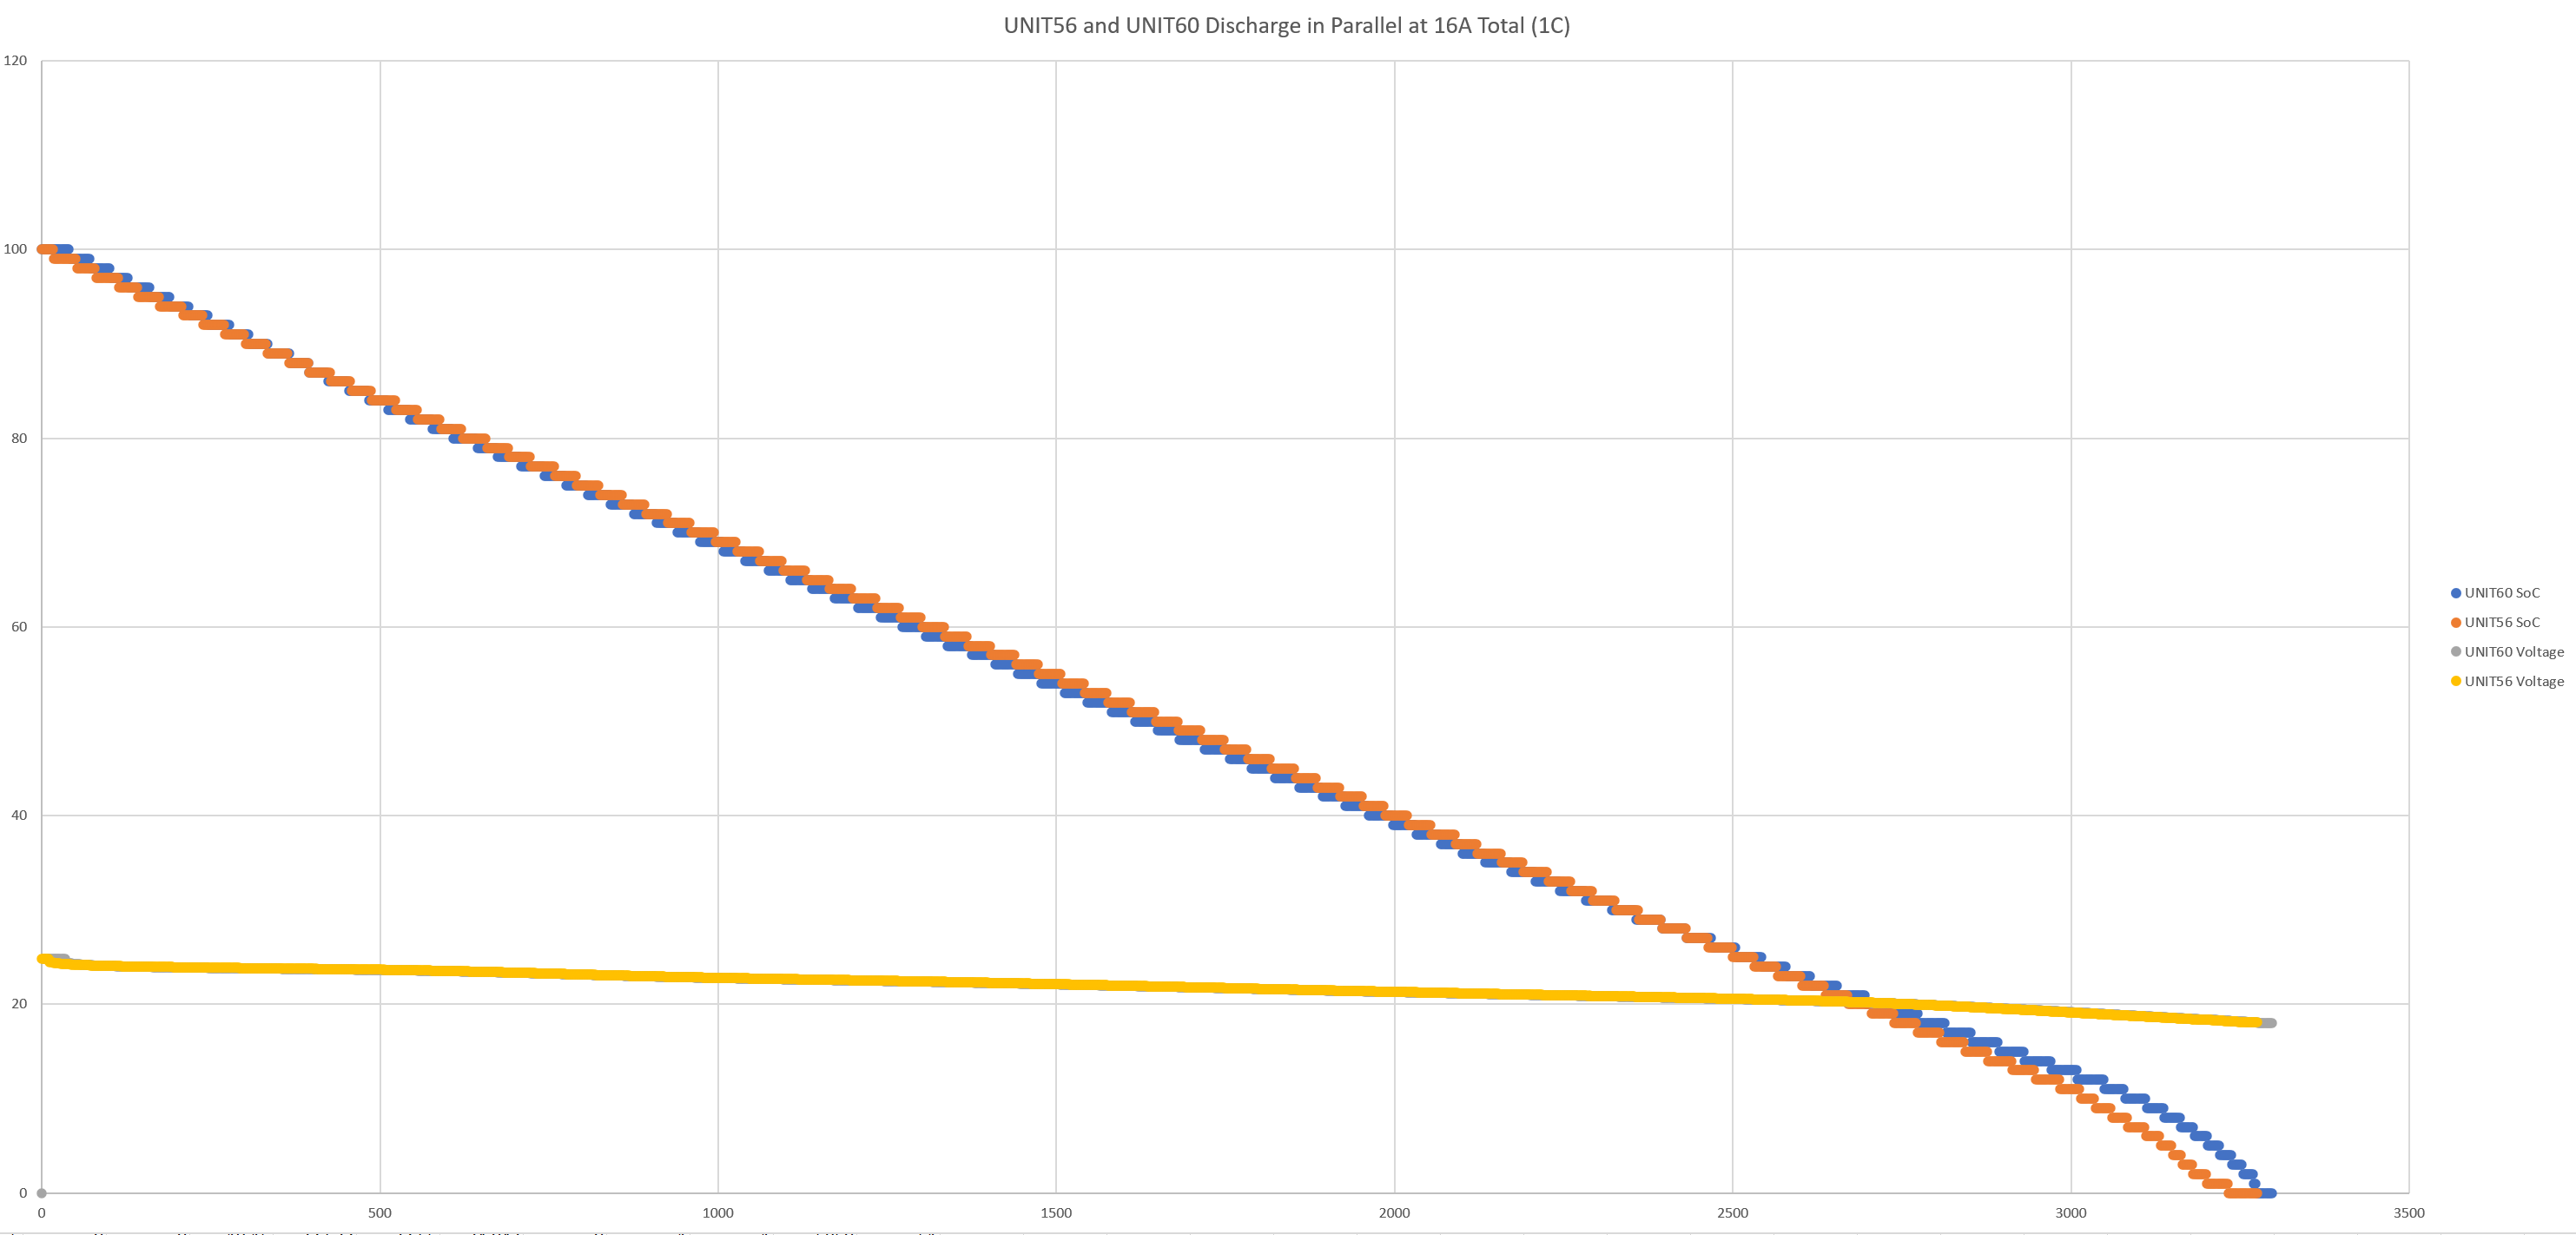
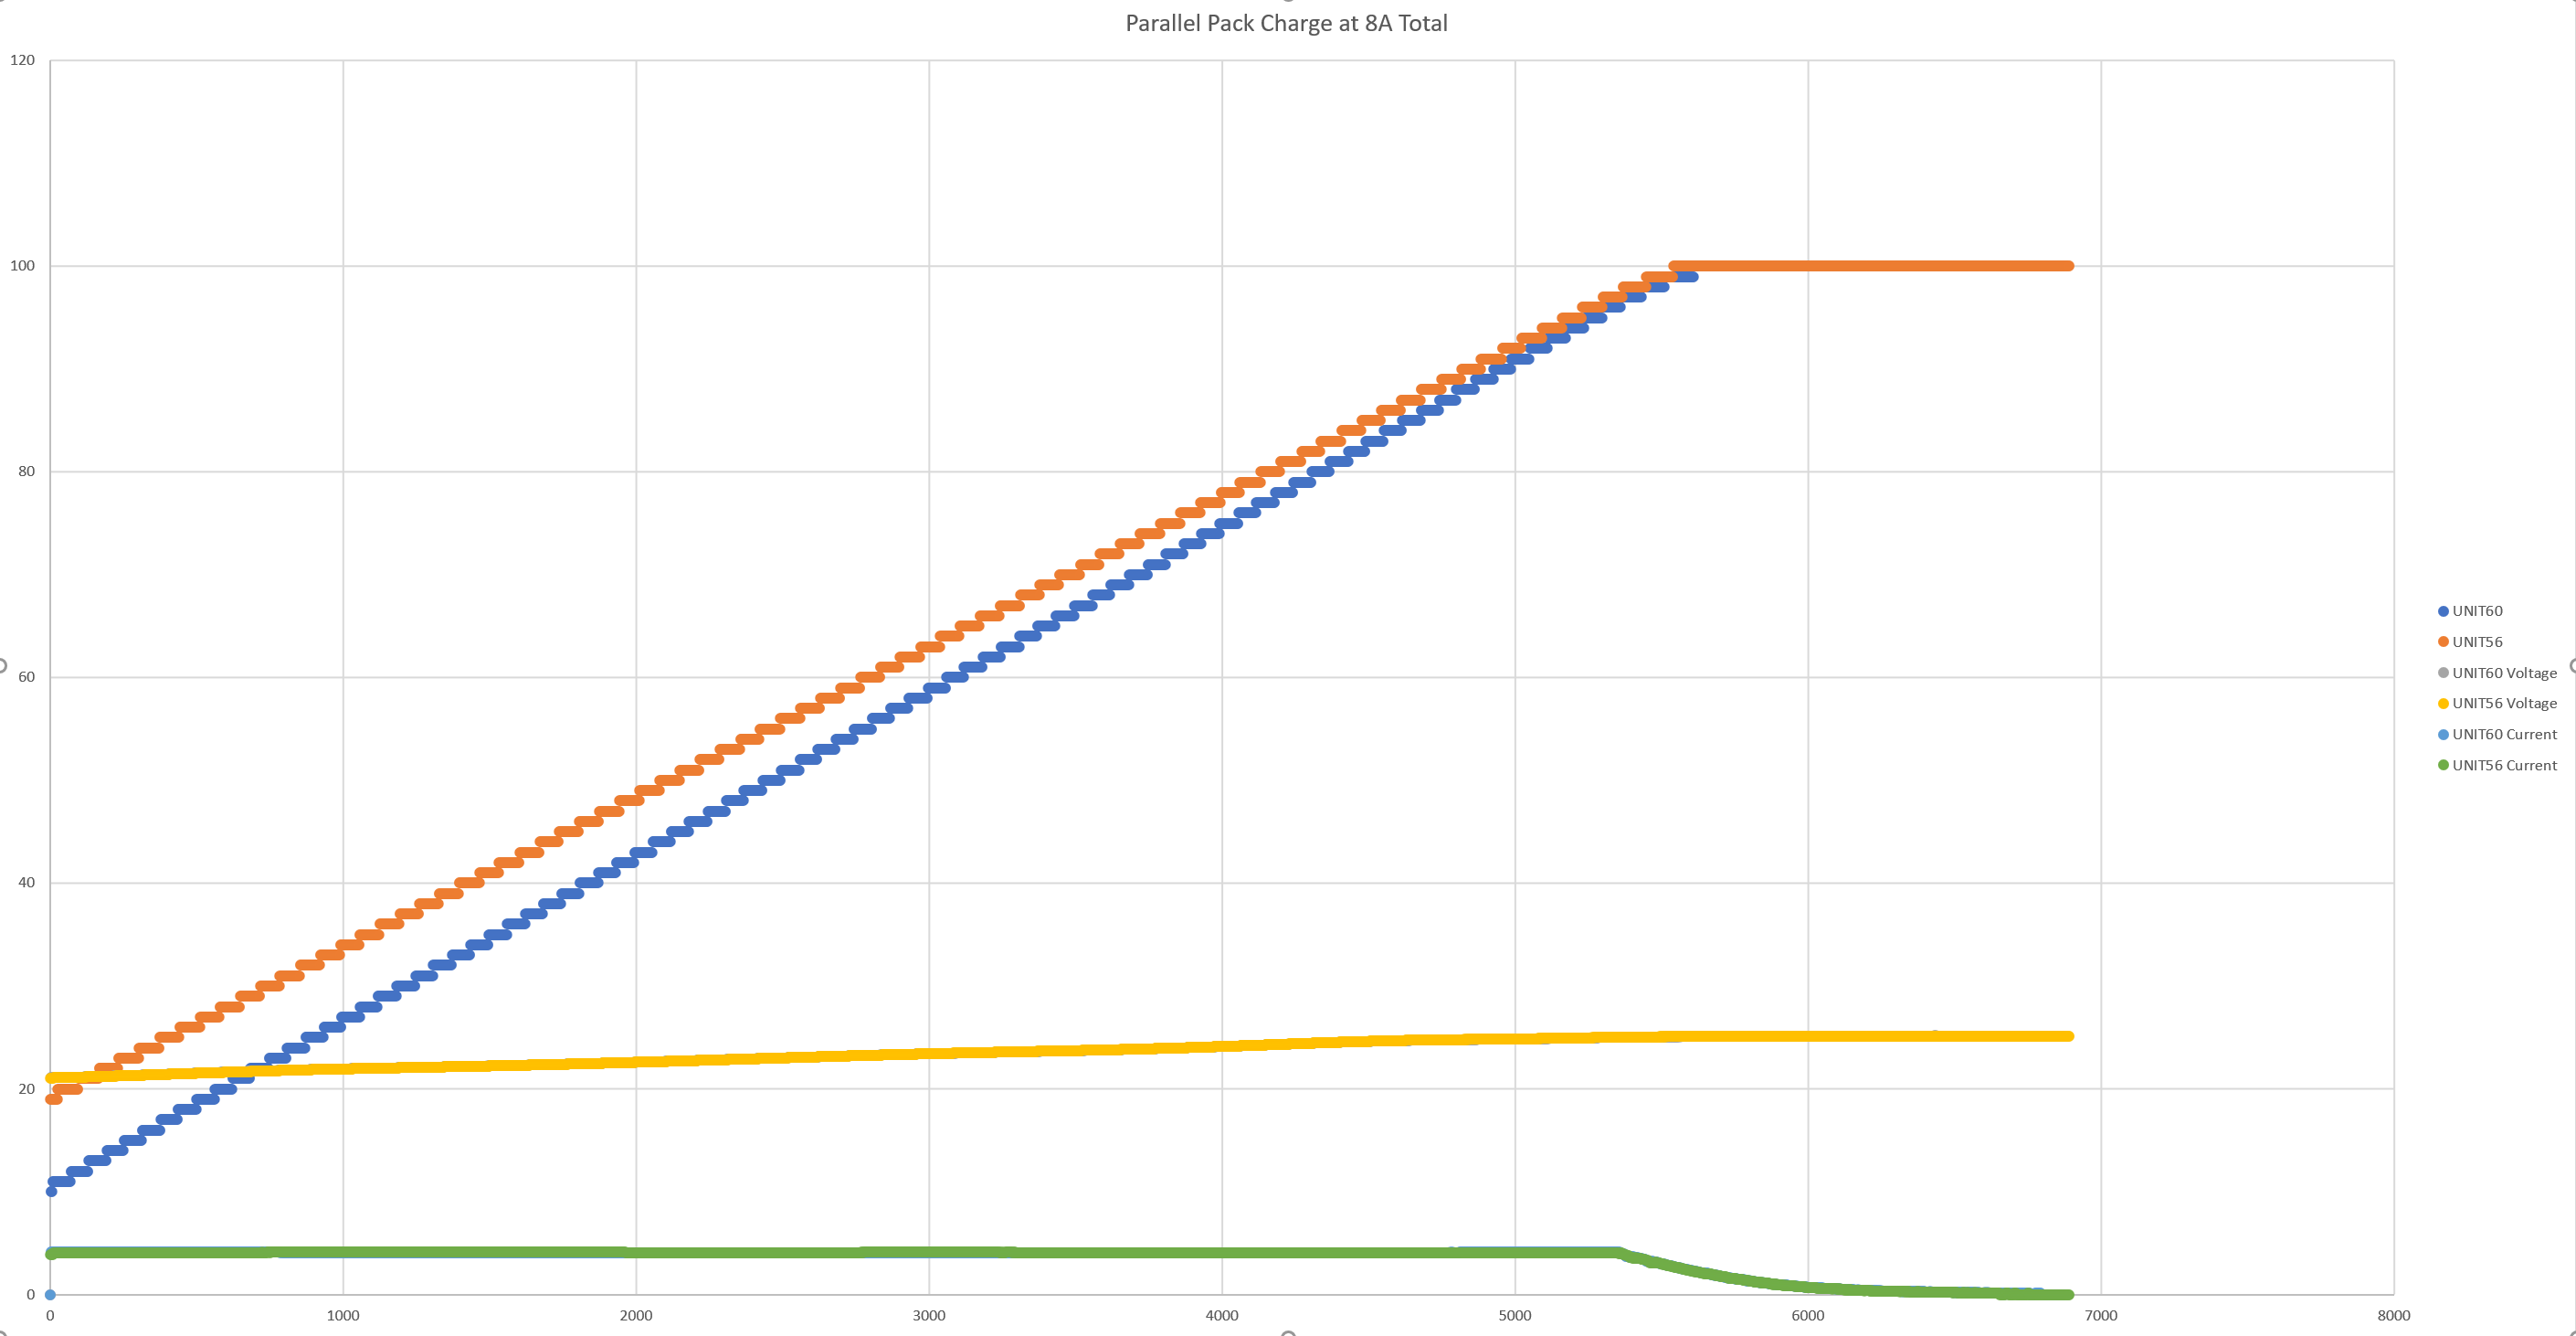
Overall this seems to work fairly well, and I get some pretty good graphs showing SoC decreasing properly, but sometimes after sitting a while packs drift in SoC to values that don't make sense. After sitting for a while shouldn't the gauge look at it's OCV, adjust the SoC a little bit and hold it at that value until voltage or current significantly change? Why would SoC continue to vary without discharging? When I charge or discharge them, they end up hitting 0% or 100% before end of charge/discharge sometimes as well. It is very frustrating for users to see packs at very different SoC values at the same voltage.

How many cycles should I do with newly produced packs to help them learn become more accurate? Is this required? How many cycles should I do with the pack that is used for the golden image after the learning cycle is completed? Will this help? Is the error probably just a matter of not doing enough cycles before creating a golden image?

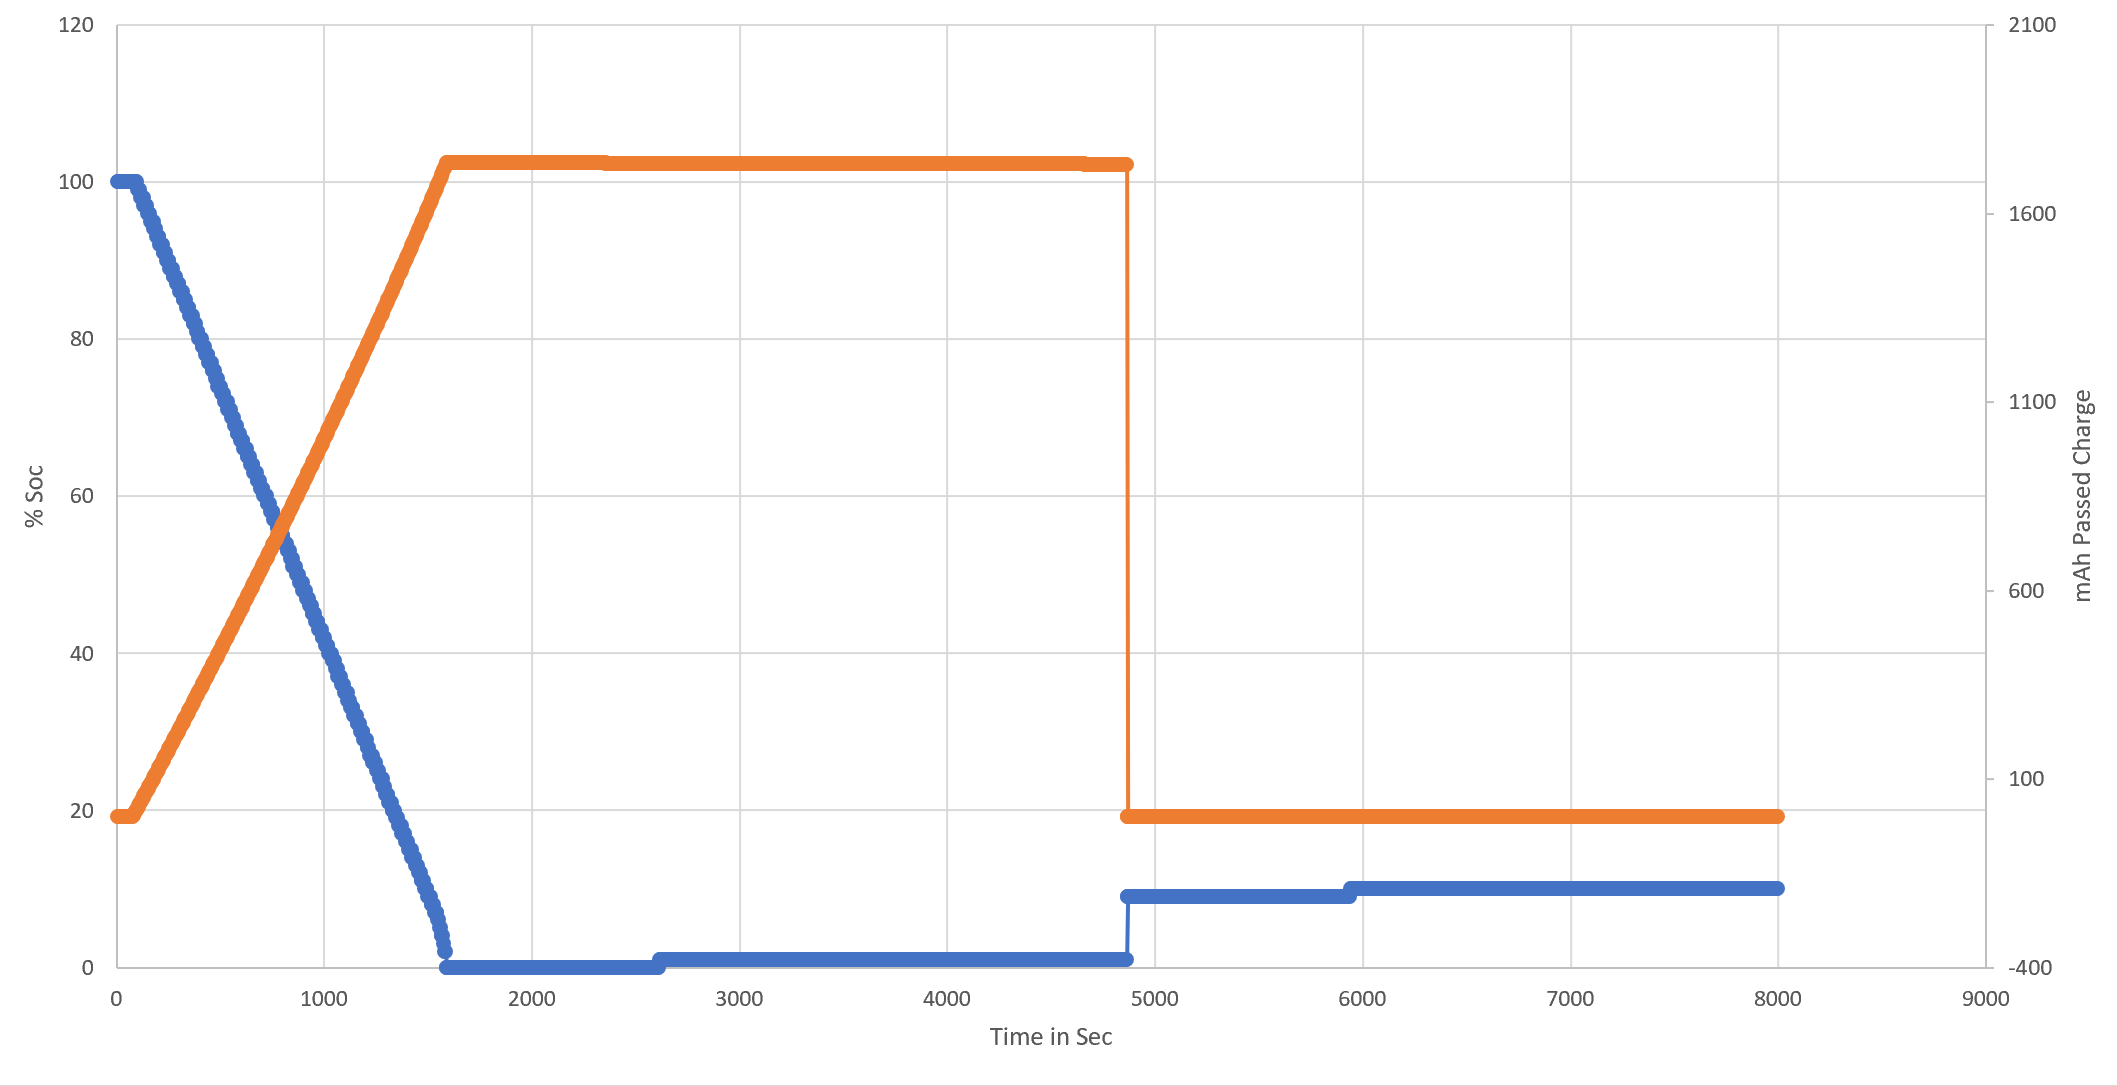
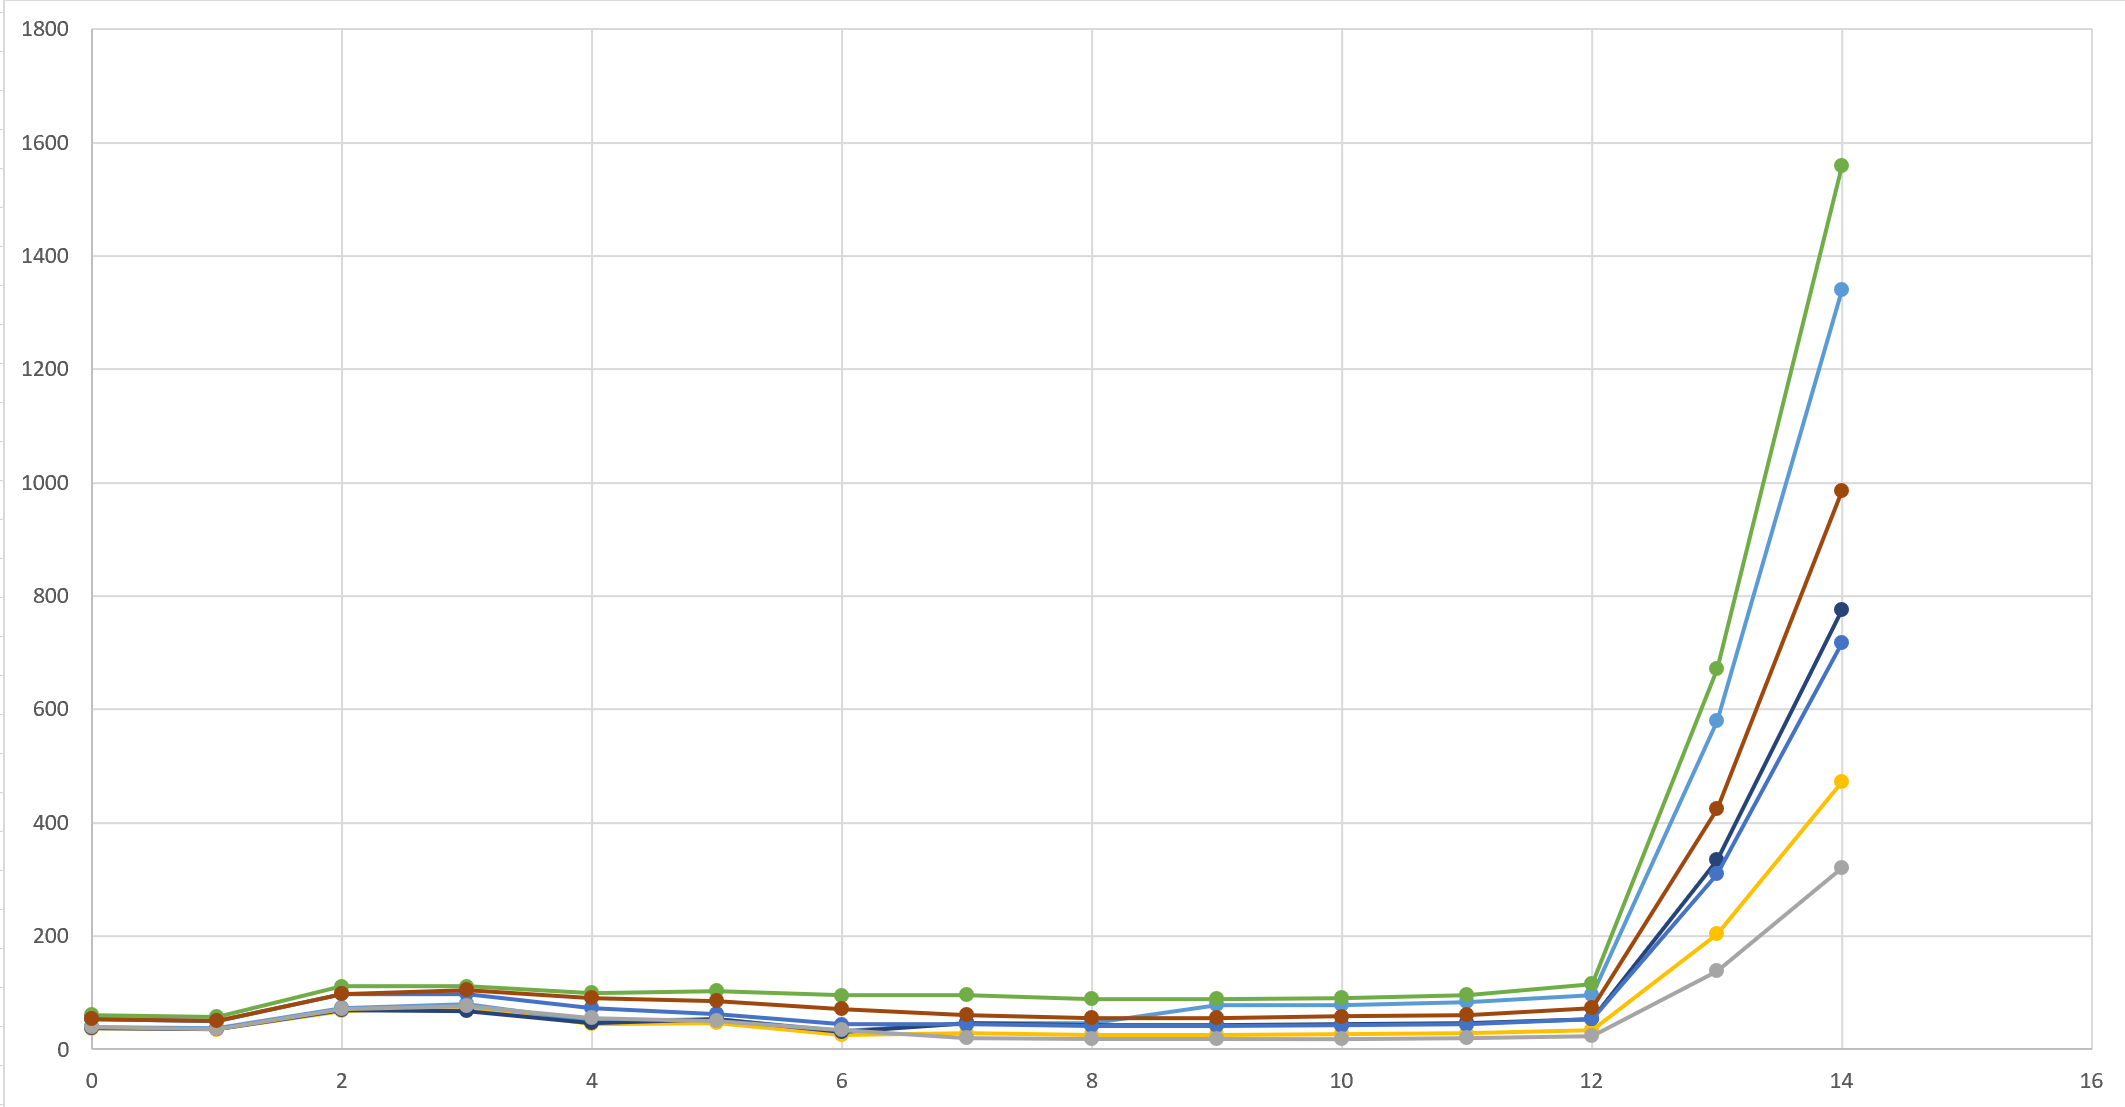
Also, I have been watching the Ra Tables and they seem to vary quite a bit between packs. Is this normal? See the attached plot:

I could send my entire dataflash / parameter files to a TI expert if needed. I appreciate any feedback!

  • Here is an interesting plot of two batteries connected directly in parallel, discharging at 1C each, then charging together at C/2 each. Unfortunately I cutoff the lower portion of the graph during charge, but I think one was starting from around 9% SoC and one was zero. The interesting part was that they both discharged to 0% SoC right around the cutoff voltage of 18V (3V/cell) under load. After a period of relaxation, I noticed that they went up in SoC value after the OCVTAKEN bit was set, where one was about 7% and the other was 9%, then between the time that I checked this and when they started to charge, one of them had dropped back to 0%. 

    In thinking about this and looking at the graph above of the Ra table values, it seems that as the impedance raises during the end of discharge the inaccuracy may grow and be correlated?

  •  Hi Cory,

    Thanks for reaching out to gauge support.

    The information you provided is quite detailed, could you also provide log file when SOC is changing as well as .gg file as we dig further into the issue? I see you made some changes, many of the configuration works fine with default values though. One more thing is the small Rsense may cause measure error, which might be interfering with SOC.

    Best Regards,

    Abraham

  • I have attached the .gg file. I will try to capture a log file soon. 

    I would be very surprised if the resistor was the issue given that the application notes you have published also use 1 mohm successfully, and the plotted SoC curves look really good and seem to track the SoC nearly perfect with the exception of the drift?

    Are there certain parameters that I modified that I should not need to?

    PublicDataMemory.gg.csv

  • I've collected a charge and discharge cycle using BQ Studio. Please see the attached log. Notice how the SoC jumps significantly after discharge. A couple things I am wondering about:DV60 Dsg Chg.log

    1. My learning cycle was based on a graph that looks like this (for a single cell). Notice that I discharge all the way down to 2.6V or less, while my application only typically discharges to 3.0V. Is that a problem?

    2. Please see the following plot of the SoC vs passed charge while relaxing after discharge. The SoC jumps up to 9 after the state change, then raises up to 10 after that as well. Why is that? Is it because the algorithm starts factoring in the 0 current draw at that point and thinking that there is still 9% capacity if discharge is super slow? Can I change that so that it always assumes the value is going to be 2C by maybe setting the load select to 6 (user defined rate)?

  • Also, does commanding the gauge into full sleep via I2C as I am doing shortly after a charge or discharge (to save power) affect the ability for it to do gauging accurately?

  • Also, I collected one more log of discharging from 100% to about 50% at 2C, then let it rest for a long time, then pulled 0.1A (below the 50mA*4scale=0.2A deadband I have set), then relaxed, then pulled 1.0A. The SoC went to 50% and sat there after discharge, then went to 49% after pulling 0.1A for quite a while, as expected, then dropped a fair amount more after pulling 1.0A for a while, but then post drawing 1.0A, the SoC jumped back to 50%.DV60 mid.log

  • Hi,

    The cells will relax upward after discharge, the gauge then takes an OCV measurement during relax and the SOC is updated accordingly.

    best regards,

  • Hey Nick, yes, I totally understand the cell relax behavior. As I asked above though, how does the Load Select parameter affect that? 

    Have you guys had a chance to review my logs and parameters overall as well?