This thread has been locked.

If you have a related question, please click the "Ask a related question" button in the top right corner. The newly created question will be automatically linked to this question.

BQ40Z50-R3-DEVICE-FW: Remaining Capacity and RSOC drop

Part Number: BQ40Z50-R3-DEVICE-FW

Hi!

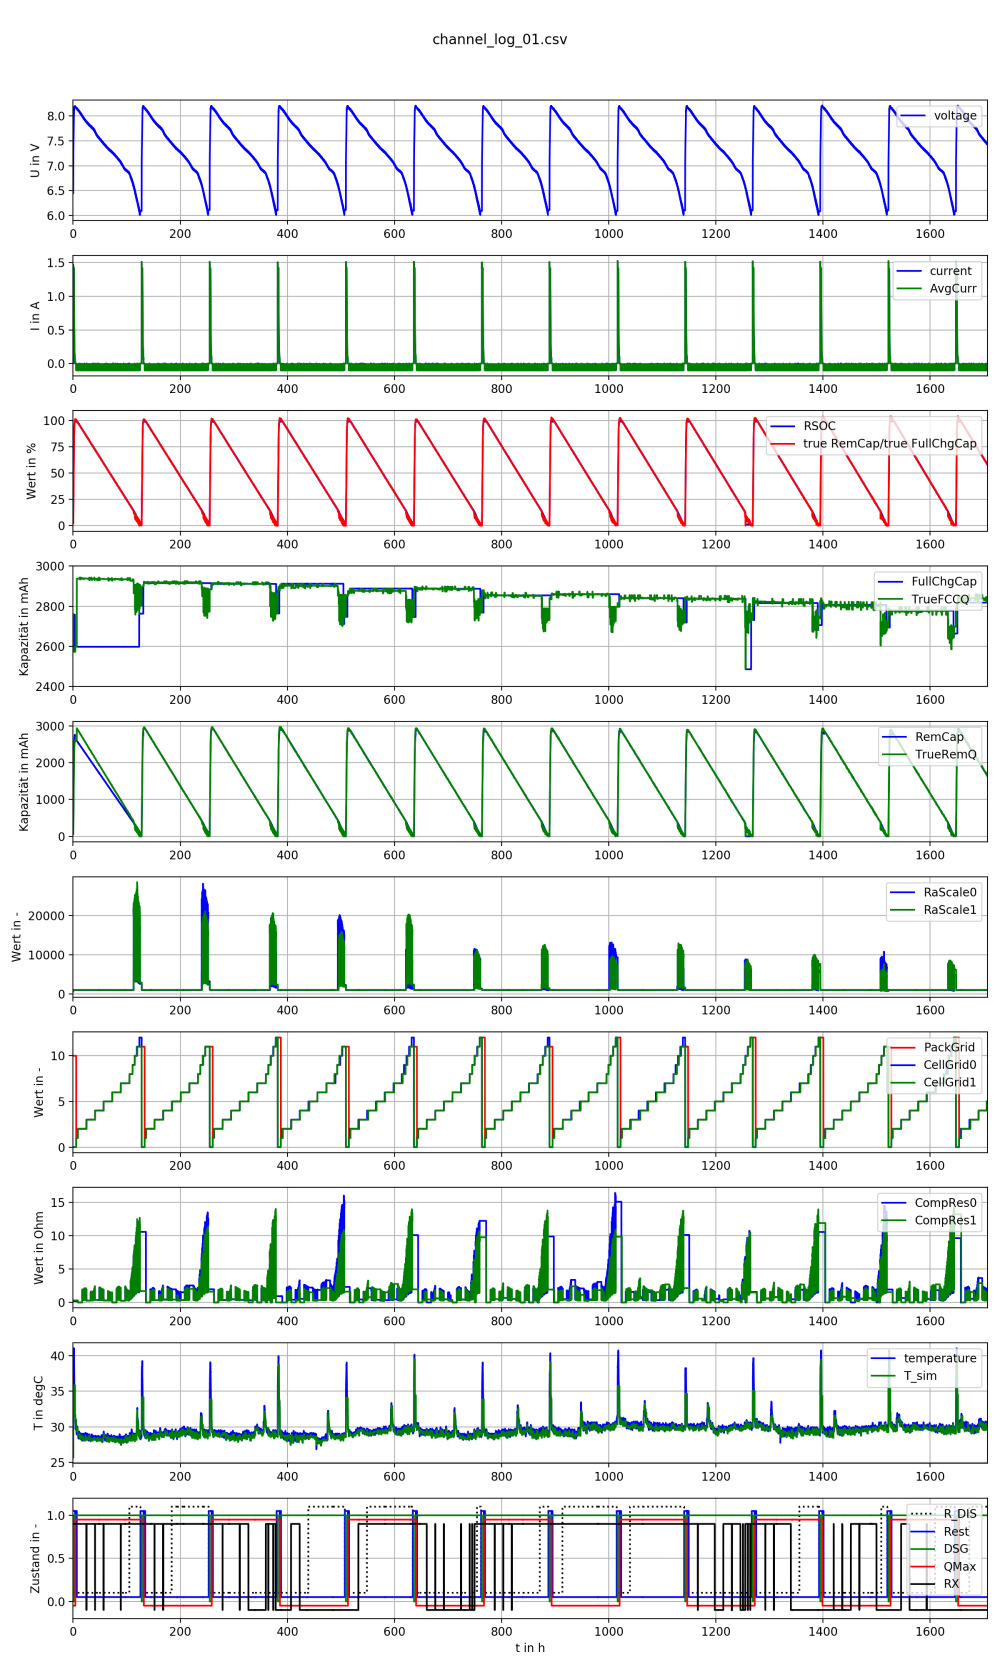
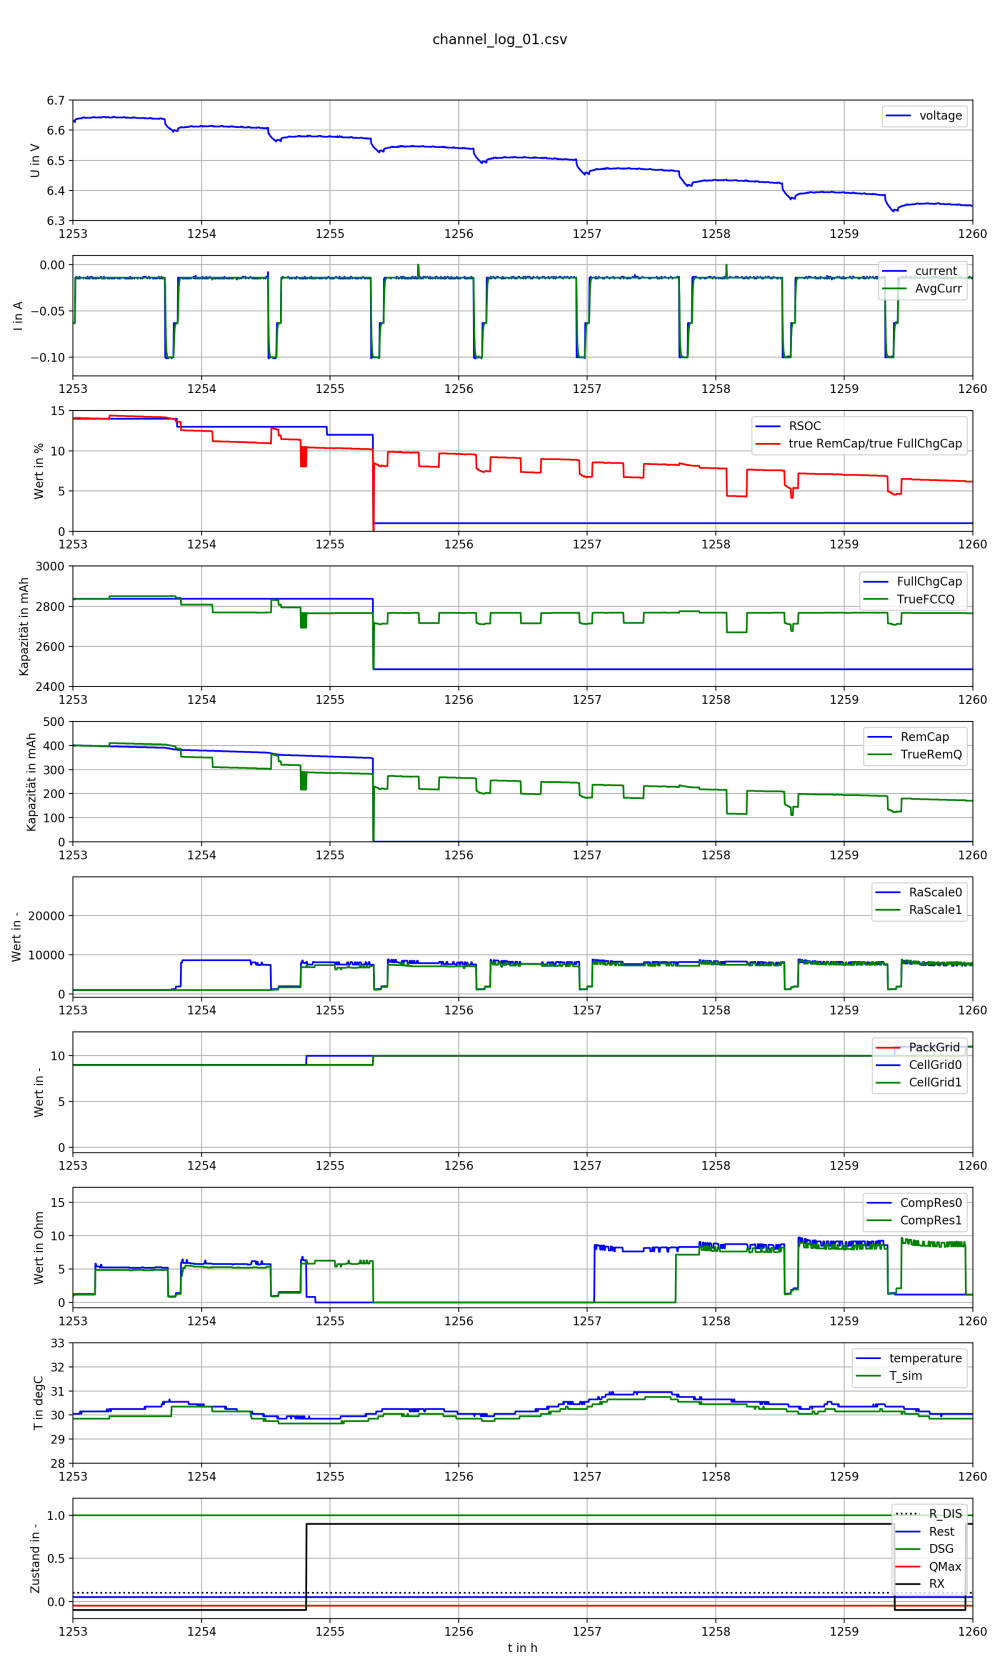
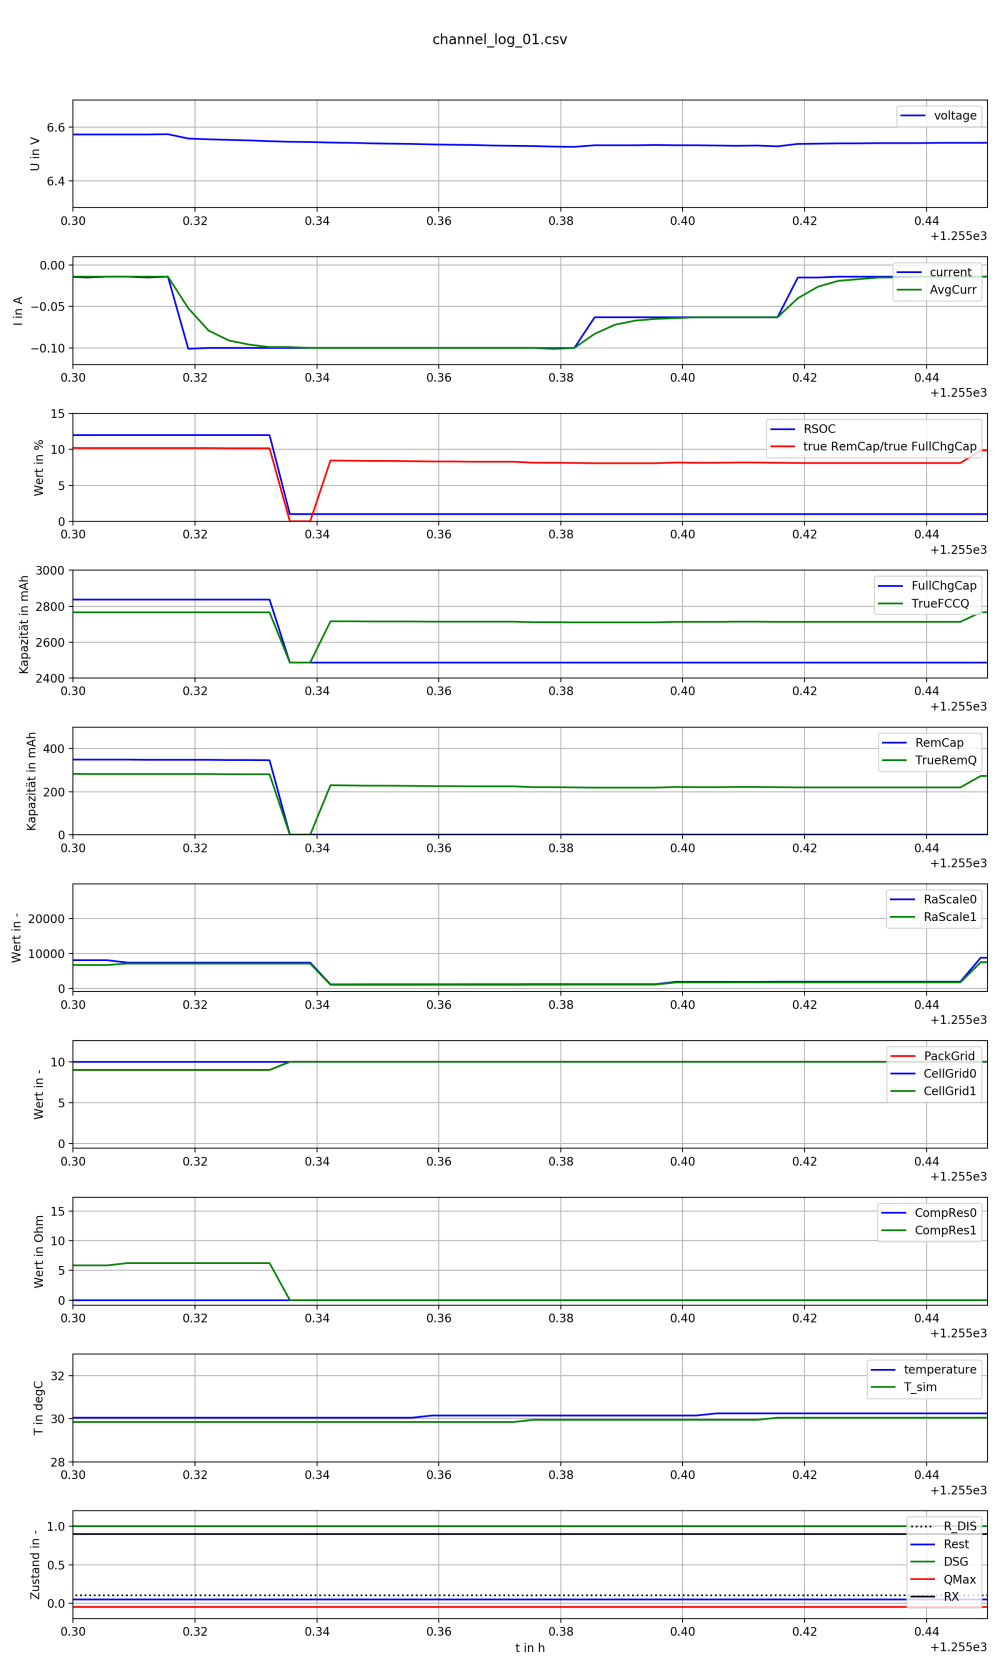
We are currently performing long-term tests with our battery pack (bq40z50-r3, 2 Li-Ion cells in series). In one cycle, we found that RSOC drops from 10% to 1% significantly too early and remains at 1% (see figures below). unfortunately this is an issue in our application..


In this context we have the following questions:
1) Why do the Remaining Capacity and RSOC drop so massively here?
2) Why does the True Remaining Capacity (TrueRemQ) recover, whereas the Remaining Capacity (RemCap) stays low? Smoothing is enabled.
3) What can we do about this behavior (e.g. configuration change)?

BMS01_2021-04-30.gg.csv

Best regards
Bernhard

  • Bernard,

    It is very hard to see anything in these images. Are you able to provide the log file. If it is too large can you just cut out a few of the problematic cycles. 

    Also the GG you provided is this from after all of this testing or is it the golden image one pre-cycling? 

    To answer some of your other questions

    1) with smoothing enabled SOC is never allowed to increase while discharging

    2) True RemCap is always the RAW values that are from the gauge. SOC is a result of the smoothed one to attempt to eliminate jumps/drops. 

    Thanks,

    Eric Vos

  • Thanks for the feedback! The GG was read after the test cycles on April 30, 2021. The RSOC drop was observed on April 11. The plots in my previous post show the measured data from BMS01 at different levels of detail. I have attached the data from the problematic cycle as a CSV file and as an interactive Bokeh plot (HTML file).
    We had a comparable jump on a second device. I can supply the data if needed.
    Unfortunately, the CSV file is not from bq-studio. We are running various tests with 10 battery packs in parallel, using a self-made logger. Temperature is in K. T_sim and T_ambient are in native bq40z50 values (no scaling or conversion). A known bug is that DOD0PassedQ and DOD0PassedE are interpreted as unsigned values during readout. If these are relevant to the analysis, please let me know. I can convert them to meaningful values if needed.
    Best regards
    Bernhard Gross
  • Hi!

    Any News? Could you Analyse the data?

    Best regards,
    Bernhard

  • It's not possible to fully analyze this with the available data but I can explain what most likely causes this.

    The gauge uses a combination of capacity predictions and coulomb count to calculate SOC, with SOC [%] = 100 * RM/FCC. This is either rounded or ceil/floor to an integer, depending on gauge.

    RM = remaining capacity. FCC = full charge capacity. Both are in mAh.

    RM is determined with coulomb count and discharge simulations where the gauge predicts how the loaded voltage changes with a predicted current and predicted cell temperature. It integrates the predicted passed charge until the predicted voltage drops below a threshold. This simulation is always going to be an estimate because it is a prediction of the future.

    FCC is calculated with a discharge simulation too.

    Because discharge simulations are expensive from a power budget point of view, they are only performed at specific times during a discharge, except close to end of discharge. For example, if a temperature change exceeds a threshold or if the depth of discharge crosses one of 15 thresholds.

    Your pictures indicate that a capacity simulation, a prediction of future capacity based on your load prediction configuration, yielded a sudden lack of capacity (i.e. the predicted voltage for a predicted current and predicted temperature dropped below the terminate voltage (+margin for load spikes) immediately, returning 0mAh capacity for this trigger.

    The gauge will then set SOC to 1% until the actual (not predicted, but measured) voltage drops below terminate voltage (without a margin).

    The gauge uses "true" (unfiltered) gauging results internally - what you see with your data is that the gauge calculated 0mAh capacity for one prediction. And then it recovers for the next prediction. However, if you enable smoothing, the gauge will *not* allow RM (and SOC) to recover. They will be stuck at 0 mAh (and 1%) until you charge or voltage drops below terminate voltage. This is by design and a property of the smoothing algorithm.

    Your pictures show a rapid change in predicted values (true RM recovers quickly) and that is because the gauge will run capacity simulations at a rapid pace close to end of discharge. This is due to a feature called "fast resistance scaling" where the gauge tries to scale cell resistance to eliminate the error between measured voltage and simulated voltage. It looks like one of the first predictions was so "off" as to force true RM temporarily to 0 mAh and that leaves smoothed RM stuck at 0.

    It's not feasible to determine the root cause based on the data that you provided with 100% certainty. The only way to know this for sure is to run the *exact* data (including all learned configuration info) through a gauge simulator, which at this point isn't an option.

    Here is my best explanation: The smoking gun is the CellGrid1 change from 9 to 10 right when true RM dropped to 0mAh. This indicates that the grid point triggered capacity prediction ran into a problem right from the start of the prediction. Cell1 R_a_10 is massively higher than lower grid points (1498mOhm vs. 1142mOhm (R_a_9) and 798(!)mOhm (R_a_8)) and because your idle current doesn't indicate that the gauge entered relax, the gauge will immediately use the R_a_10 to calculate the loaded voltage with the predicted current and temperature. With this resistance being so high, it predicts 0mAh capacity.

    And here is what I suggest:

    1. Make sure you run a clean learning cycle all the way down to 3000mV with a load that allows the gauge to learn cell resistance (between C/3 and C/5) while measuring all 15 grid point resistances. This is important to make sure that R_a_10 isn't too high.

    2. Make sure that your load prediction settings are adequate. This depends on your system - I have to refer to the section in the TRM about Load Mode/Select. It may be necessary to use a User Rate if the adaptive load select options aren't a good match for your system.

    3. Set the quit current and discharge current threshold to reflect your system's loads. Your quit current setting is 10mA. However, your semi-relax phase, lasting about 40 minutes, shows approx. 14mA of load current. Because of this, the gauge will stay in discharge mode and it will not consider cell transient response when discharge resumes (for the gauge it was always in discharge), hence it will immediately apply full cell resistance in its capacity prediction and when it moves from CellGrid9 to 10, where cell resistance as per you gg file is suddenly 31% higher, leading to the 0mAh TrueRM. I'd set quit current to 60mA and discharge current to 90mA. Note that these thresholds do not mean that the gauge won't coulomb count (=ignore the 15mA load) but that the gauge will not impedance track when the current is below quit current. Which it shouldn't do anyways, if the cell is basically relaxing (10mA (your setting for quit current) is C/288 so that's way into relax. My proposal, 60mA and 90mA, is around C/50 and C/32 so still well outside usable impedance tracking currents and this will likely fix the problems because the algorithm is going to model cell resistance more conservatively if it "thinks" the next discharge pulse follows a semi-relaxed phase of 40 minutes.)

  • Thank you very much for the detailed answer!
    We will reconfigure a few modules according to your recommendations. Due to the long cycle times, the results will unfortunately only be available in a few weeks.
    We still have the following questions in this context:
    1. Is it possible that due to the low currents the Ra updates lead to an undesired increase of the resistance values? Immediately before the start of the test, the entries in the Ra table were significantly lower (see attached file). If so, what can we do about it? Would increasing the quit current and discharge current values also bring an improvement here?
    2. If the CellGrid1 jump from 9 to 10 is the trigger for the RM plummeting to 0 mAh, why is the true RM adjusted back up virtually immediately afterwards? The CellGrid1 value does not change after the jump.

    BMS01 after FW update.gg.csv

  • #1: The gauge won't learn cell resistance if the average current is below C/10 so this should prevent erroneous updates due to insufficient load. However, there's a chance that cell resistances get updated incorrectly if the averaging filter is a bit too slow and the actual discharge stops close to a point where the gauge takes measurements and the gauge is in discharge state. So yes, changing the threshold may affect this.

    #2: Because the gauge will run discharge simulations rapidly close to end of discharge if fast resistance scaling is enabled (default setting and you screen shots show this) and if the reasons for the 0mAh result in the preceding simulation was due to a simulated cell voltage that was right at terminate voltage + delta voltage (=the margin is very small), then the next sim may be just above that small margin and capacity recovers. The gauge will predict current, temperature and calculate voltage based on these predictions so depending on the progression of the current and voltage prediction, subsequent simulation iterations can stay above terminate voltage + delta voltage long enough to unlock significant capacity, hence true RM can recover quickly but filtered RM (and SOC) are stuck at zero due to the smoothing engine rule set.

  • Thanks for the feedback!

    We have a maximum discharge current of 100 mA and a design capacity of 2880 mAh. So C/10 would mean 288 mA. Correct? Since the maximum current is 100 mA, the average current cannot exceed 100 mA. Therefore, I would expect that in our test setup, no updates to the Ra table would be possible.

    In my first plot, you can see that the RX bit toggles even though C/10 is never exceeded. If I understand it correctly, a toggling of the RX bit means that a Ra grid point has been updated.

    No Ra updates below C/10 would imply that the bq40z50 is a poor choice for applications where C/10 is not exceeded. Is this in fact the case? The change in cell resistance over lifetime could not be taken into account in such applications.

  • If your discharge current is never above C/10, then there's another qualifier for resistance updates. If the measured voltage is at least 50mV below the cell's OCV for the present depth of discharge and temperature, then the gauge will also try to calculate cell resistance. If the chemistry is compatible with your cell, then that's usually the exception for loads that are significantly less than C/10.

    In general, impedance tracking relies on the gauge measuring a significant voltage drop over the internal cell resistance so if your load is very small, then chances are the gauge won't be able to track impedance. It still will measure chemical capacity. In cases like yours where the maximum load is small, from a gauging perspective, it would be good if there was the possibility to patch in a higher load (e.g. a load resistor with a FET to switch it on/off) every few weeks so that the gauge can measure cell resistance reliably.