This thread has been locked.

If you have a related question, please click the "Ask a related question" button in the top right corner. The newly created question will be automatically linked to this question.

TDA4VM: Coredump at glBindFramebuffer

Part Number: TDA4VM

Hi Ti

gpu version is 1.13.5776728 

SDK 7.2

Linux

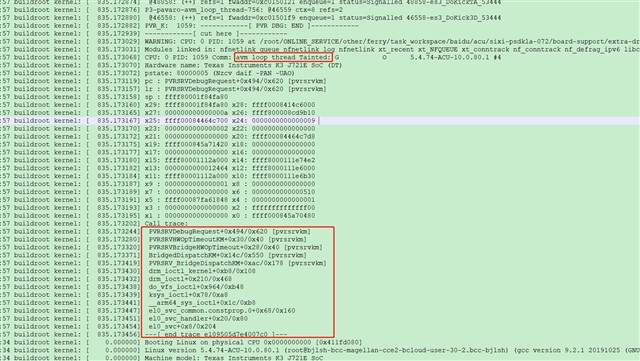
The glBindFramebuffer coredump problem reappears. The current situation is the same as the original problem. See the link below for relevant information

https://e2e.ti.com/support/processors-group/processors/f/processors-forum/1161957/tda4vm-coredump-appears-when-glbindframebuffer-is-executed/4385393?tisearch=e2e-sitesearch&keymatch=%252525252520user%25252525253A486294#4385393

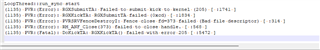
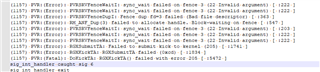
According to the last communication, we collect the PVR related log

run:

pvrdebug -loggroups main,mts,hwr

exceute app,coredump

 pvrlogdump_7002010852.gz

  • To add a question, there is a kernel dump problem today, which is also in the PVR content

    Please see the following information

  • Since this GPU issue with two signatures, as suggested to increase vdd_core and vdd_cpu by 50mv

  • Hello , we have 2 problems 

    1 . glBindFramebuffef  appears coredump 

    2.  kernel dump 

    Which problem does this solution “suggested to increase vdd_core and vdd_cpu by 50mv”  correspond to?

  • for both, i'm suspecting a GPU powering issue instead of software ones. Let's try it out. 

  • Hello

    This method doesn't work,we found that coredump is most likely to occur when starting an app

    So we conducted a test on startup
    Test method: Start the app and Wait 200 seconds and restart
    7 coredump occurrences in 20 hours

  • Hello,

    I've looked through the previous thread, but I am not sure what the latest state of your SDK version + GPU driver version is and what patches you have currently applied. Can you please summarize this, below are my current assumptions:

    1) SDK version - 7.2

    2) GPU Driver version - 1.13.5776728 from SDK 7.3

    3) Patches on GPU Driver - None

    I will take the current logs that you have provided and check with our team. In the meanwhile, can you please make sure that you have this patch applied to your GPU Kernel driver:

    diff --git a/services/server/devices/rogue/rgxccb.c b/services/server/devices/rogue/rgxccb.c
    index 3a8db74..369226e 100644
    --- a/services/server/devices/rogue/rgxccb.c
    +++ b/services/server/devices/rogue/rgxccb.c
    @@ -598,7 +598,9 @@ PVRSRV_ERROR RGXCreateCCB(PVRSRV_RGXDEV_INFO	*psDevInfo,
     								PVRSRV_MEMALLOCFLAG_DEVICE_FLAG(FIRMWARE_CACHED) |
     								PVRSRV_MEMALLOCFLAG_GPU_READABLE |
     								PVRSRV_MEMALLOCFLAG_GPU_WRITEABLE |
    -								PVRSRV_MEMALLOCFLAG_CPU_WRITE_COMBINE |
    +								((RGX_IS_FEATURE_VALUE_SUPPORTED(psDevInfo, NUM_OSIDS) &&    \
    +								(RGX_GET_FEATURE_VALUE(psDevInfo, NUM_OSIDS) == 8)) ? \
    +								PVRSRV_MEMALLOCFLAG_CPU_CACHE_INCOHERENT : PVRSRV_MEMALLOCFLAG_CPU_WRITE_COMBINE) | \
     								PVRSRV_MEMALLOCFLAG_ZERO_ON_ALLOC |
     								PVRSRV_MEMALLOCFLAG_KERNEL_CPU_MAPPABLE;
     
    diff --git a/services/server/devices/rogue/rgxfwutils.h b/services/server/devices/rogue/rgxfwutils.h
    index 7906647..4f7018a 100644
    --- a/services/server/devices/rogue/rgxfwutils.h
    +++ b/services/server/devices/rogue/rgxfwutils.h
    @@ -475,7 +475,9 @@ static INLINE IMG_UINT64 RGXReadHWTimerReg(PVRSRV_RGXDEV_INFO *psDevInfo)
                                           PVRSRV_MEMALLOCFLAG_GPU_CACHE_INCOHERENT | \
                                           PVRSRV_MEMALLOCFLAG_CPU_READABLE | \
                                           PVRSRV_MEMALLOCFLAG_CPU_WRITEABLE | \
    -                                      PVRSRV_MEMALLOCFLAG_CPU_WRITE_COMBINE | \
    +                                      ((RGX_IS_FEATURE_VALUE_SUPPORTED(psDevInfo, NUM_OSIDS) &&    \
    +                                      (RGX_GET_FEATURE_VALUE(psDevInfo, NUM_OSIDS) == 8)) ? \
    +                                      PVRSRV_MEMALLOCFLAG_CPU_CACHE_INCOHERENT : PVRSRV_MEMALLOCFLAG_CPU_WRITE_COMBINE) | \
                                           PVRSRV_MEMALLOCFLAG_KERNEL_CPU_MAPPABLE | \
                                           PVRSRV_MEMALLOCFLAG_ZERO_ON_ALLOC)


    Regards,

    Erick

  • Hello

    Confirm that this patch “3000.pp132915-caching-fw-ro-structures-v2_1_13a” 

    NOT printed on  TDA4VM - SDK7.2  (in use)

    I‘ll test again after printed

    1) SDK version - 7.2 : yes

    2) GPU Driver version - 1.13.5776728 from SDK 7.3  : from this document

    3) Patches on GPU Driver - None  :yes not printed

  • Please update your test result after applied those GPU kernel driver patch. thanks. 

  • Hello  Erick 、Xu

    patch “3000.pp132915-caching-fw-ro-structures-v2_1_13a”  not work

    coredump problem occurs once in two hours

  • Daming, thanks.

    As i suggested last day, kindly please make sure to invoke "appEglWindowOpen" and it's earlier dependency before your this native program under test. I'm asking this to rule out the potential dependency between dma-fd surfaces and kernel's page allocate. 

    Erick, please go ahead and provide more analysis comes from PVR dump. 

  • Thank you for trying this patch, will get back to you shortly with the results of the analysis.

    Regards,

    Erick

  • Thank you
    We will also check all version changes that caused the problem

  • Hello 

    Can you provide so for all gpu related signed tables and add the following compilation options:

    -lasan

    Let me add some logs for finding problems:

    1.stdout :

    (1132) PVR:(Error): PVRSRVFenceWaitI: sync_wait failed on fence 370 (22 Invalid argument) [ :222 ]
    (1132) PVR:(Error): PVRSRVFenceWaitI: sync_wait failed on fence 370 (22 Invalid argument) [ :222 ]
    (1132) PVR:(Error): RGXSubmitTA: Failed to submit kick to kernel (205) [ :1741 ]
    (1132) PVR:(Error): RGXKickTA: RGXSubmitTA failed (0xcd) [ :1834 ]
    (1132) PVR:(Fatal): DoKickTA: RGXKickTA() failed with error 205 [ :5472 ]
    sig_int_handler caught sig 6
    sig_int_handler exit
    sig_int_handler releasing pavaro...
    2. syslog:
      476  Sep 12 20:16:34 buildroot kernel: [    1.639298] virtio_rpmsg_bus virtio3: creating channel ti.ipc4.ping-pong addr 0xe
      477: Sep 12 20:16:34 buildroot kernel: [    1.681084] pvrsrvkm: loading out-of-tree module taints kernel.
      478: Sep 12 20:16:34 buildroot kernel: [    1.701871] PVR_K:  144: Read BVNC 22.104.208.318 from HW device registers
      479: Sep 12 20:16:34 buildroot kernel: [    1.701878] PVR_K:  144: RGX Device registered with BVNC 22.104.208.318
      480: Sep 12 20:16:34 buildroot kernel: [    1.702144] [drm] Initialized pvr 1.13.5776728 20170530 for 4e20000000.gpu on minor 0
      481  Sep 12 20:16:34 buildroot kernel: [    1.704619] remoteproc remoteproc6: powering up 64800000.dsp

      615  Jan  2 00:00:02 buildroot kernel: [    5.475700] random: 7 urandom warning(s) missed due to ratelimiting
      616: Jan  2 00:00:02 buildroot kernel: [    5.769046] PVR_K:  444: RGX Firmware image 'rgx.fw.22.104.208.318' loaded
  • Erick, do you have any update on this thread please?

  • Erick would update the here for log capture. 

    Daming, do you have any update about the back steps to your code base? what's the result now?

  • Hello 

    We are currently narrowing the scope to two commits, can you come here and review the code together ,because it is an occasional occurrence and align the testing method again?

  • Hello Erick 

    Can you provide .SO for all gpu related debug information and add the following compilation options:

    -lasan

    we have been working together to identify issues

  • Daming, kindly please update your atype patch and the GPU thread priority changes here so that Erick can review and suggest next steps. 

    Erick, Baidu updated to us that the CPU priority increase doesn't fix this issue and atype change causes initialization failed around share memory. need your advice to move on and also please provide the analysis from IMG by the logs shared previously. 

  • Hello,

    So the a-type patch causes a failure? This is one of the downsides of the patch, it will not work around some shared-memory usecases.

    IMG has reviewed the logs, but do not see any failure in the driver. They are requesting that you re-collect a fresh set of logs with more options enabled to determine if there are any other issues in the firmware:

    pvrdebug -loggroups main,mts,csw,bif,pm,rtd,spm,pow,hwr

    PVR_SRVKM_PARAMS="EnablePageFaultDebug=1" /etc/init.d/rc.pvr start

    Can you provide .SO for all gpu related debug information and add the following compilation options:

    Unfortunately, it is not something we can share due to licensing of the driver. Usually, we have 2 options:
    1) Sharing Application, and we can take care of collecting logs and analysis

    2) Sharing Logs, and we can do the analysis

    Regards,

    Erick

  • Daming, please update the ticket by more test result and logs, otherwise we will close this ticket. 

  • Hello  Erick 

    pvrdebug -loggroups main,mts,csw,bif,pm,rtd,spm,pow,hwr     OK

    PVR_SRVKM_PARAMS="EnablePageFaultDebug=1" /etc/init.d/rc.pvr start  ??

    Execute this command before running the app, or edit the file?

    do I still execute pvrlogdump after coredump?

  • Hello Li,

    PVR_SRVKM_PARAMS="EnablePageFaultDebug=1" /etc/init.d/rc.pvr start  ??

    We need to start the GPU driver with this command. In order to do this, we need to blacklist the GPU driver so that it does not auto-load. Can you please follow the instructions on this FAQ on how to blacklist the GPU driver from auto-loading:

    https://e2e.ti.com/support/processors-group/processors/f/processors-forum/1218307/faq-how-can-i-analyze-a-gpu-graphics-process-unit-driver-or-hardware-issue

    Look for "Disabling auto-loading of the GPU driver".

    This way, you can manually load the GPU driver with the debug arguments PVR_SRVKM_PARAMS="EnablePageFaultDebug=1".

    This is executed before you run the app, because otherwise the GPU driver would not be loaded and you couldn't run your app.

    Then you run your app.

    Then you collect the logs using pvrlogdump as before.

    Thank you,

    Erick

  • Hello Erick

    I have added running parameters in rc.pvr, as shown in the following figure

    because our underlying software will automatically load driver and start, and I will manually execute "/ rc.pvr stop ./ rc.pvr start" after the system starts, then run app

    Is this method effective ?

  • Erick, this issue happens frequently in the recent fan out programs, so please kindly need your support on priority now. thanks. 

  • Hello  Erick

    We use

    PVR_ SRVKM_ PARAMS="Enable PageFaultDebug=1 and

    pvrdebug - loggroups main, mts, csw, bif, pm, rtd, spm, pow, hwr parameters get new log.

    other : stdout ,syslog

    Please transfer to IMG for analysis as soon as possible. Thank you

    pvrlogdump_7002010802.txt.gz

    other.zip

  • Hello,

    because our underlying software will automatically load driver and start, and I will manually execute "/ rc.pvr stop ./ rc.pvr start" after the system starts, then run app

    This method is not effective at this point, we will need to ensure that the system does not load the GPU driver automatically. Is there any way to disable your system from loading the driver automatically? The blacklist steps I shared take care of default system initialization, but if you have something else in your system that does this it will be a problem.

  • Hello Erick

    1. We will disable the automatic loading of drivers for the underlying software and conduct testing again

    2. Due to the uncertain recurrence time of the problem, PLEASE  ANALYZE THE LOGS  provided through the "./rc.pvr stop,./rc.pvr start" method that we provided it yesterday.

    After calling the rc. pvr stop, we observe that the driver has been unloaded

    3. On the problematic version, we will use the default loading method (./rc. pvr) instead of loading from the system for testing

  • Hello Erick

    “but if you have something else in your system that does this it will be a problem."

    Disable our software to automatically load drivers, there are still issues

     follow “blacklist”  new log below

    505_2.zip

  • Hello,

    Thanks for collecting, I've delivered both set of logs for analyzing.

    Question, do you run OpenVX framework? Or are you rendering to a display that is controlled by Linux?

    Thanks,

    Erick

  • Hello Erick

     do you run OpenVX framework?

    yes,Our app's other functions will call tiovx

    are you rendering to a display that is controlled by Linux?

    no,the rendered output is a shared memory,this shared memory is bind to eglimage, 

    We also observed that the bound fbo is not display (share memory) when the glBindFramebuffer problem occurs

  • Hello Erick

    The following problems are found in our tests in the past two days related to the simultaneous call of "tda4_performance" when our app runs. At present, the call frequency is once every 5s

    Is calling 'tda4_performance' unsafe?

    --------------------------------------------------------------------------------------------------------------------------------------------------

    Hello Erick

    We found that the problem of glFinish() blocking for more than 5 seconds, with a maximum duration of 500 seconds, almost appeared together with the current issue in the latest version. The original discussion link for this issue is as follows:

    https://e2e.ti.com/support/processors-group/processors/f/processors-forum/1163802/tda4vm-calling-glfinish-blocks-for-more-than-a-minute/4387011?tisearch=e2e-sitesearch&keymatch=%252525252520user%25252525253A486294#4387011

    we got  pvrlogdump stdout. syslog  and "PVRTune  data",The most common occurrence of glfinish block in the last 10 seconds of "PVRTune  data"

    8664.zip

    We suspect that the blocking of the glFinish for a few seconds is closely related to the current discussion of the coredump situation, as they almost appear together in the same version. Please also check this log.

    This issue has a very serious impact. Do I need to create a new order?

  • Hello Li,

    After the analysis of the logs, I have the following comments:

    So, the second close() is actually closing a handle that GLES created after the first close. It is the application that could be corrupting the userspace GLES.

    Could you review the application please.

    Are you aware of this in your application? Please let me know.

    Thanks,

    Erick

  • We suspect that the blocking of the glFinish for a few seconds is closely related to the current discussion of the coredump situation, as they almost appear together in the same version. Please also check this log.

    Perhaps these analysis findings can help with this issue as well. The "close()" function seems to be doing something strange in your application and it needs to be reviewed.

    It could be un-related as well, but we won't know until the concern from the analysis is addressed.

    Thanks,

    Erick

  • Hello Erick

    Does ' second close 'refer to the "FD" operations performed inside the bind fbo or “gles FBO"?  ”FD“  are not visible to the upper layer.

    1. We conducted the following tests first and found that there will be no coredump

    2. From the screen printing and above result, it can be seen that a Bad file descriptor has occurred in PVR, and it is suspected that it may be ”the handle has been damaged“?

    3. Currently, it has been found that a module in our app used for resource monitoring in the application (such as monitoring CPU, IO, etc.) may be related to this issue, and is currently being analyzed and tested

    If it is an fd issue, how can we effectively monitor fd?

  • Hello Erick

    Could you review the application please.

    Are you aware of this in your application? Please let me know.

    We found that the 'resource monitoring module' in the app has a decisive impact temporarily based on current testing,The sub functions in the "Resource Monitoring Module" are highly relevant as follows:

    1.CPU monitoring

    Through the proc file system/ proc/stat

    2.IO monitoring

    Netlink implementation, once a second

    3.Memory monitoring

    Obtained through the interface provided by Jemalloc, once a second

    4.DDR_ Bandwidth monitoring

    popen calls tda4_proformance Performance, every 5 seconds

    This resource monitoring module is within the app and currently only affects the GPU. Please check if the current information is relevant?

  • Li,

    It looks like from your logs that there is a glError reported with index 0x506:

    There is a framebuffer that is not complete, and this is what the initial analysis of the logs indicates as well. You can try checking the following function:

    https://registry.khronos.org/OpenGL-Refpages/es3.0/html/glCheckFramebufferStatus.xhtml

    This can give more insight to the framebuffer attachments. And we can see when the FRAMEBUFFER_COMPLETE is being returned, and when it suddenly changes to something else.

    Regards,

    Erick

  • Hello Erick 

    FBO complete check has been added to the code, and this function needs to be used after glBindFrameBuf,We haven't found any issues yet. We will pay attention to this

    Are there any doubts about the following functions related to coredump?

    1.CPU monitoring

    Through the proc file system/ proc/stat

    2.IO monitoring

    Netlink implementation, once a second

    3.Memory monitoring

    Obtained through the interface provided by Jemalloc, once a second

    4.DDR_ Bandwidth monitoring

    popen calls tda4_proformance Performance, every 5 seconds

  • Erick, according to communication with customers, there were significant system monitors about the system level performance via both tda4 performance profiler and Linux fs entries invocation. After disable those monitors, the coredump issue within the glbindframebuffer would NOT appear any more. 

    The missing part is, how the system level to cause a coredump at a fixed gl API every time? any clue from the source code implementation perspective? 

  • Hello,

    Can you please share what the tda4_performance program is? Is it part of our SDK offering?

    I'll check these points.

    Thanks,

    Erick

  • Hello Erick

    Is it part of our SDK offering

    Yes

  • Daming, please upload the tda4-performance part of source code here if you need Erick to review and find some clues. thanks. 

  • Daming,

    I spoke with the team, and I don't see how the tool could impact the performance of the test. Would it be possible to only remove the GPU loading from the tda4-performance tool and see if this helps with the symptoms?

    I believe that part of the code will read the GPU loading from the debug filesystem, which will try to read this file:

    /sys/kernel/debug/pvr/status

    Please disable reading this file to see if anything changes.

    Thanks,

    Erick

  • Hello  Xu

      We directly used the bin file in SDK without recompiling it

  • Suspecting caching issue b/w A72 and GPU. Need to revisit the atype patch and make sure which not conflict to customer's DDK revision build and watch the test result. 

  • After week of stress test, customer confirmed that the issue is disappeared when fixed the double close(close folder first then close the file within it...) within the heavy applications of source code.

    it sounds like the abnormal operations at application level would corrupt the kernel space in range of DDK for some reason. 

    Thanks all the debug across of teams and appreciate Erick's support on IMG trace analysis and communication.  

  • Hello Xu ,Erick

    We found that a thread in the application layer performs a double close  fd, which can cause the finish to not return and occasionally cause the glbindframebuff core dump problem.

    At present, the issue with the double close fd can be directly reproduced with the rendering test program.

    The problem has been fixed and long-term observation has been conducted.

    Thank you, Eric Liu Xu, for your help