


Hi,
I am experiencing a problem when I try to visualize
a IPC message in expressions window. I have 8
messages I am able to visualize messages 0-6
but when I try to unfold message 7 content I get
a window with the follow message:
C66xx_0: Trouble Reading Memory Block at 0x5718309a on Page 0 of Length 0x1: (Error -1183 @ 0x7B) No device bus slots available to service the request. Upgrade this request to high priority to force the device to generate a bus slot to service the request. Note that this would be intrusive to the your program. (Emulation package 5.0.838.0)
C66xx_0: Trouble Reading Memory Block at 0x5718309b on Page 0 of Length 0x1: (Error -1202 @ 0x57183098) Device core is hung. The debugger will attempt to force the device to a ready state to recover debug control. Your application's state will be corrupt. You should have limited access to memory and registers, but you may need to reset the device to debug further. (Emulation package 5.0.838.0)
C66xx_0: 8 other operation(s) were automatically canceled as a result
Here the steps I follow when I get this trouble
1) I can see str_messages 0-6 and ,for test I created some extra messages, str_messages 8-9

2) When I try to see what is the content of str_message[7] I get the trouble
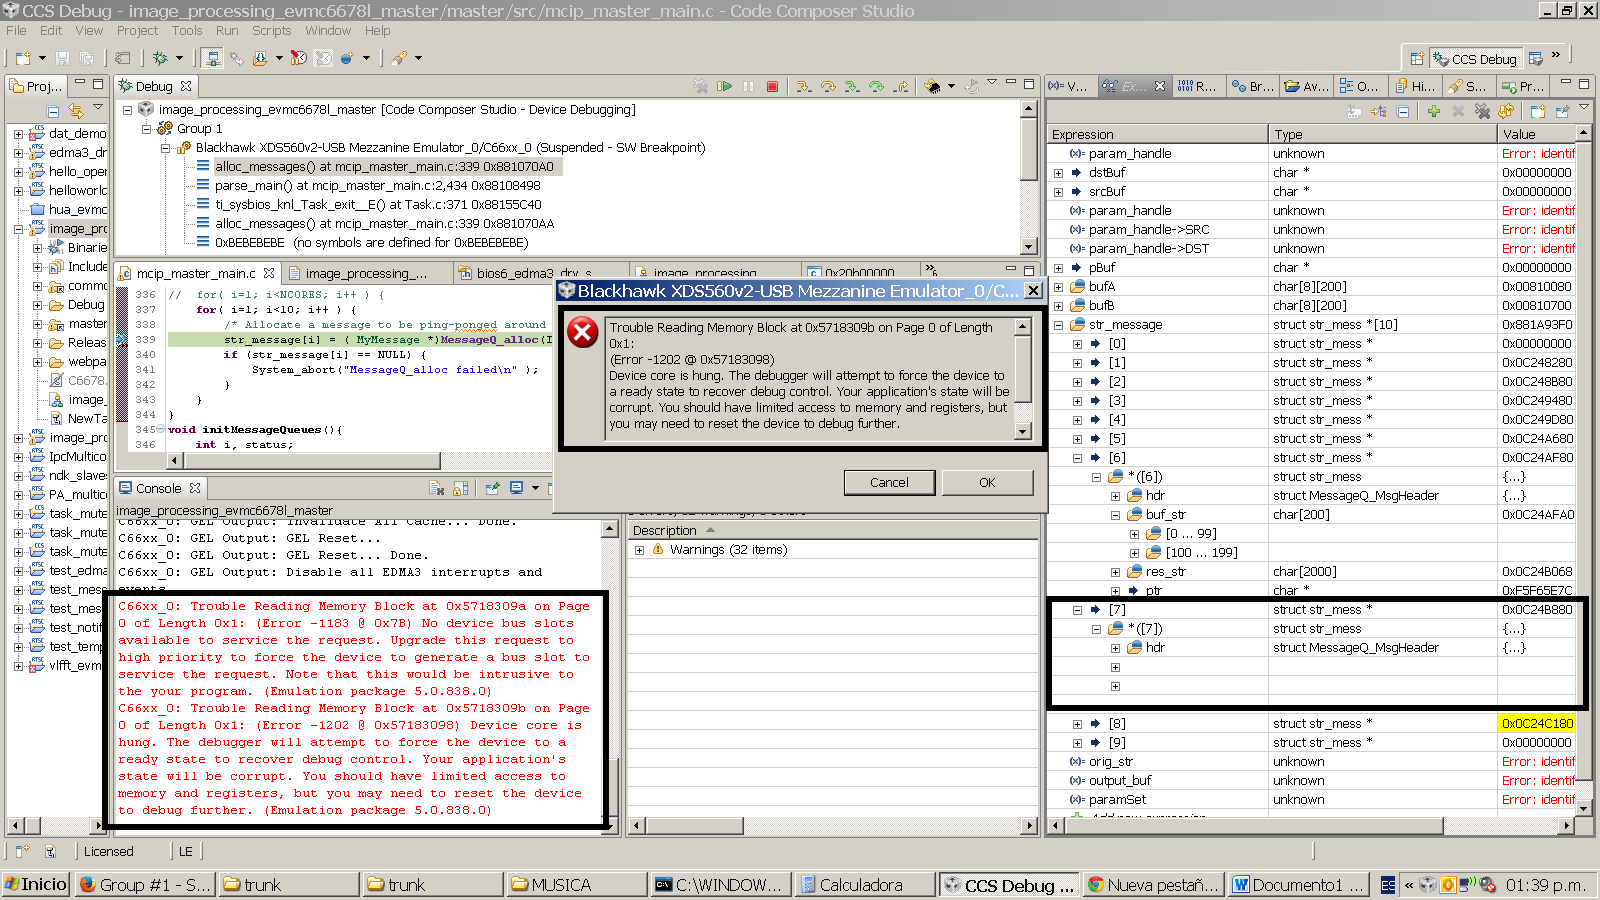
I was thinking that I was allocating in a erroneous memory section but
address of that message is 0x0C24B880 that is in multicore shared memory region
that is defined from 0x0C200000 to 0x0C3FFFFF.
The strange thing is that it is only for str_message[7], for messages 8-9 it displayed them
well.
Hope someone could help me to find out what is going wrong.
Thanks in advance.
Julian
