This thread has been locked.

If you have a related question, please click the "Ask a related question" button in the top right corner. The newly created question will be automatically linked to this question.

RTOS/AM3358: UIA module compatbility

Guru* 95265 points

Part Number: AM3358
Other Parts Discussed in Thread: SYSBIOS

Tool/software: TI-RTOS

Dear all,

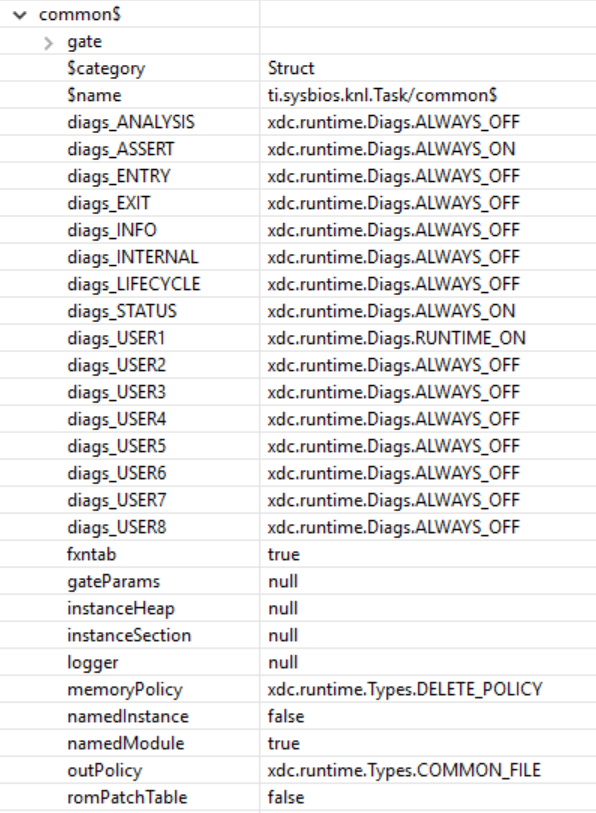
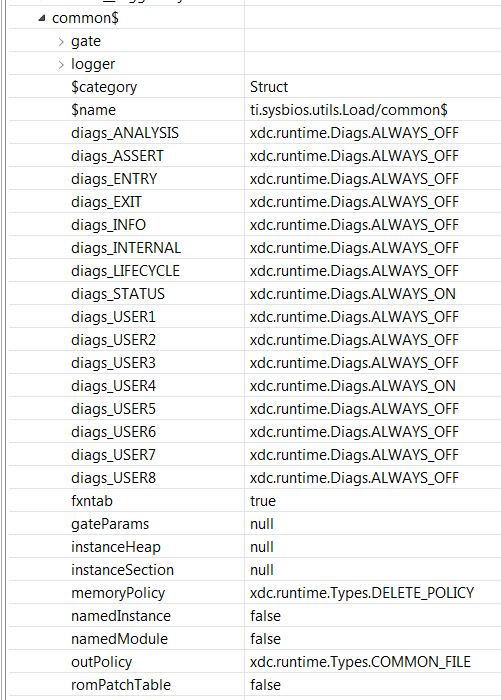
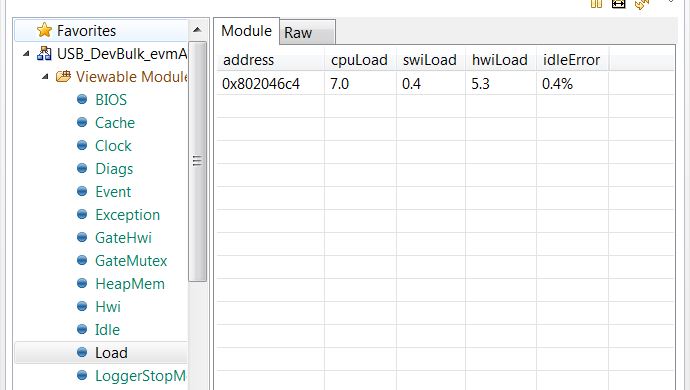
I have a RTOS example on A8, I wanted to measure the CPU load, with the tools SYSBIOS 6.52.00.12 + XDC 3.50.03.33 + UIA 2.21.2.7, It worked for me, with the attached .cfg file. I also attached the worked case live session., it showed the CPU load is collected at 0.5, 1.0, 1.5 ... seconds. 

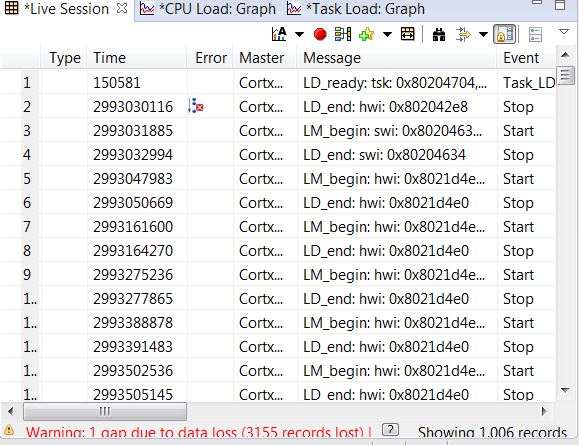
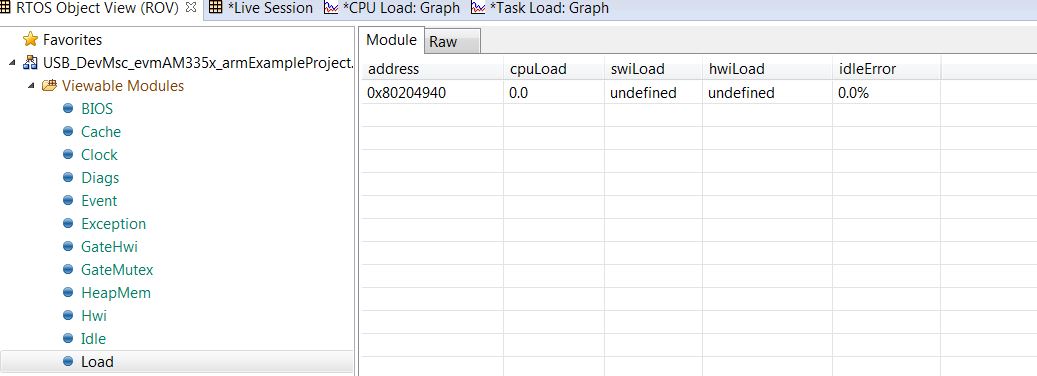
For the same example with the same .cfg, I tried an older tool set (SYSBIOS 6.46.5.55 + XDC 3.32.1.22 + UIA 2.0.6.52) which customer used. I have Live session, execution graph collected, but the CPU load and Task load are empty. The Live session seems only start from 1.841 seconds (no data from time 0 to 1.841, and no CPU load), the event class column has no "CPU", the live session data is also attached.

Can you comment why the CPU load can't be collected? 

Regards, Ericworking.csv 

failure.csv

3755.usb_arm_am335x.cfg

  • Hi Eric,

    I did a quick diff of the SYS/BIOS and UIA versions you have listed. Nothing jumped out to explain the issue. On the customer's setup can you get a snapshot of ROV->Load->Raw->Configuration->common$. It will look something like this. 

    I want to see what the target has configured.

    Also, what does ROV->Load->Module show?

    Todd

  • Todd,

    Thanks for the help! I attached several pics for the failure cases and working cases:

    Failure:

    1) I saw a gap of data loss 

    CPU load is 0%

    Working case:

    I still see data loss in live session (no pic attached)

    CPU load is no zero, also reflected in CPU load graph

    Regards, Eric

  • Edit to the previous post, the correct one is in the working case, I still saw the gap of data loss
  • Todd,

    There is the latest update:
    With SYSBIOS 6.46.5.55 + XDC 3.32.1.22 + UIA 2.0.6.52, we can get live session for an standalone application, from live session we have CPU load info, although CPU load graph is still empty.

    When the standalone application is integrated into the full application, we want to measure the CPU load again with the same UIA configuration, but this time we can't get live session recording. 

    Attached is .cfg if you can check any mistake:amic11x_app.cfg


    Regards, Eric

  • We moved away from the rta.Agent module in the .cfg. Can you just use LoggingSetup?

    Also, all the data should be in ROV->LoggerStopMode also. Let's rule at System Analyzer and just look at LoggerStopMode in ROV. Do you see the Load events there before adding the standalone application? What about after adding it in.

    Also, how are you integrating the stand-alone application into the project?

    Todd
  • Hi,

    For me, I can see the live session data. I can also see the ROV-----> load and ROV---->LoggerStopMode. For customer, they can't see the live session data. They don't know the tricks for ROV--->load and ROV----->LoggerStopMode, so I am not sure about if they can see there.

    So I wanted you comments if the attached amic11x_app.cfg looks right for collecting UIA data and debug steps? Let's say:
    1) they don't see the CPU load graph (empty)
    2) then they can check live session, it is also empty
    3) then they can check ROV--->load and ROV----->LoggerStopMode, what if they are empty again?

    "Do you see the Load events there before adding the standalone application? What about after adding it in." =======>
    Customer can see the CPU load in the live session with standalone only, and can't see it with integrated project. They don't want to rollback to the point before integration, so I don't have info .

    Regards, Eric
  • The real issue was resoloved after discussion offline.

    Regards, Eric