This thread has been locked.

If you have a related question, please click the "Ask a related question" button in the top right corner. The newly created question will be automatically linked to this question.

[FAQ] PROCESSOR-SDK-AM62A: How do I benchmark a neural network model on the Edge AI SDK for the AM62A or other AM6xA devices?

Part Number: PROCESSOR-SDK-AM62A
Other Parts Discussed in Thread: AM62A74, AM68A, AM62A3, AM69A

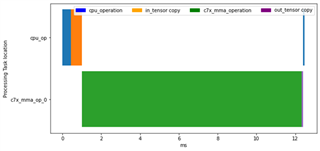
I made a model and what to understand how fast it can run on an AI accelerated device like the AM62A.

I see variations in performance based on which scripts I use, and I don’t see identical performance to what the cloud tools like Model Analyzer/Model Selection Tool show. Why is this?

How can I understand the performance of my model better?

  • For benchmarking a model, we mean running a model to understand its runtime performance, mainly in terms of how long it takes to run the model and perhaps its memory/DDR usage. We’ll leave accuracy considerations as a separate topic (see here for accuracy documentation).

    Benchmarking a model first requires compiling the model for the target SOC. Please see documentation under the edgeai-tidl-tools/doc/custom_model_evaluation.md for details or try the Cloud tool on dev.ti.com/edgeaistudio (see Model Analyzer, select a device, and open a custom notebook for your runtime and task type). Note that the compiled “artifacts” are tied to the SDK version they were compiled for, and using them on a different SDK will result in error. They are also not cross-compatible between different SoCs

  • 1. Understanding and Configuring the accelerator speed

    The directions here mainly pertain to the AM62A

    The SOC’s AI acceleration performance scales with the speed the accelerator is clocked at. The AM62A74 on the EVM defaults to 1.7 TOPS to ensure stability on all EVM revisions (online benchmarks as of March 1, 2024 also use this configuration).

    • The max performance capacity is based on 1024 MACs/cycle * 2 Ops/Mac * 1 GHz = 2,048 GOPS. 1024 MACs/cycle is a quality of the matrix multiplier, and assumes 8-bit fixed point models. Different SoCs may have a different # MACs/cycle, e.g. AM68A has 4096 MACs/cycle.
      • For maximum performance on AM62A, apply the DTBO overlay /boot/dtb/ti/k3-am62a7-sk-e3-max-opp.dtbo
        • This is only stable on E3 revisions of the EVM, which has a PMIC capable of supplying 0.85 V that is necessary for max clock speed. The revision number is on the starter kit board near the USB-A port. E2 will be unstable at this frequency, but should be fine for short-term tests at room temperature.

        • This will also disable frequency scaling in the CPU. Alternatively, change the CPU governor to a performance mode

        • apply in uEnv.txt in boot partition using the name_overlays= setting. If there are multiple DTBOs to apply, they can be space separate

          • The 9.0 SDK searches in /boot/dtb, so use name_overlays=ti/k3-am62a7-sk-e3-max-opp.dtbo

          • The 9.1 SDK searches in /boot/dtb/ti, so use name_overlays=k3-am62a7-sk-e3-max-opp.dtbo

    • The accelerator clock can also be modified/read directly using the k3conf tool:
      • k3conf set clock 211 0 1000000000 # last number in Hz is the clock speed. Max 1 GHz.

        • Use 500 MHz as the clock rate to simulate the AM62A3 variant of the SoC (DDR speed notwithstanding)

      • k3conf dump clock 211 # dump clock rates for the C7x core

    • The Arm A cores may have frequency scaling enabled. The max-opp DTBO disables this. It can also be disabled by setting the CPU governor to “performance” mode
      • Run command: echo performance >> /sys/devices/system/cpu/cpu1/cpufreq/scaling_governor
  • 3. Understanding the data path to and from the accelerator

    The image depicts the general data path for model inference calls. Within linux userspace, there are several options between python OSRT, CPP OSRT, and TIDL-RT. TIDL-RT is intended only for advanced users, and the latest documentation is shared on an as-needed basis. OSRT interfaces have more examples and documentation. It is also possible to use the CPP OSRT interface with shared buffers (see osrt_cpp examples on edgeai-tidl-tools

    Open source runtimes like TFLite and ONNX have delegates/execution providers (respectively) that can provide more timestamps about events throughout the inference. The get_TI_benchmark_data() in python exposes these.

    • The timestamps are generally collected before/after TIOVX messages on the Arm core, so they are synchronized to the HLOS (e.g. Linux) system clock and are in nanoseconds. For example:
      • stats = {
        'ts:run_start': 2288862913162,
        'ts:run_end': 2288875399330,
        'ts:subgraph_detslabels_copy_in_start': 2288863361464, 
        'ts:subgraph_detslabels_copy_in_end': 2288863910435, 
        'ts:subgraph_detslabels_proc_start': 2288863910855, 
        'ts:subgraph_detslabels_proc_end': 2288875246909, 
        'ts:subgraph_detslabels_copy_out_start': 2288875247204, 
        'ts:subgraph_detslabels_copy_out_end': 2288875303419
        }
      • Each subgraph has its own labels based on the names of the output layers. For this YOLOX-Tiny model, there are two outputs, ‘dets’ and ‘labels’ and only one subgraph.
  • 4. Reasons for differences in performance

    The overall performance can differ between one software tool and another depending on how the model time is captured.

    • When captured at a user level (difference in timestamps before and after a model is run), it will be worse than what’s reported by the runtime (i.e., get_TI_benchmark_data() function in python).
    • The Model Analyzer / Model Selection tool on https://dev.ti.com/edgeaistudio discounts the copy time to and from the A-cores and the accelerator. User-level timestamping will by default take longer than this reported value.
      1. Interrupt latency into the calling function can vary if there is a heavy load. Gstreamer has frequent interrupt messages that can cause performance to appear lower than it is for the model itself. End-to-end benchmarks are crucial, yet should be considered as a different test case than a model running isolated.

    CPU settings like frequency scaling can have a large impact on the runtime. In the default SoC configuration for AM62A, this scaling has caused up to 15ms of additional delay, and this additional delay may be inconsistent. When benchmarking, make sure to prevent frequency scaling by modifying the CPU governor or applying a DTBO like the max-opp one described earlier in this message.

    DDR has a first order impact on the model performance. Keep this in mind when comparing benchmarks on the starter-kit EVMs (which generally are configured to the max rate) vs. custom boards. Heavy load from other processes can also impact this.

  • Hopefully this brings clarity to the benchmarking process. If there’s anything to take away, let it be this:

    • Ensure the SoC (primarily the C7xMMA accelerator and Arm-A cores) is configured in a way that either matches your use case OR in the maximum performance mode
    • Understand sources of additional latency within the model inference call stack that may or may not apply to your use case, e.g. latency from compiled CPP libraries into python
  • 2. Benchmarking program

    There are several options here. A simple categorization is an isolated or end-to-end test

    1. Isolated:

    • Model Analyzer is a good source of sample code in the python jupyter notebooks, but the SoC is hosted on the network and cannot be configured (e.g. k3conf
    • Try the attached Python3 script, with a single argument pointed to your model artifacts directory.
      • /cfs-file/__key/communityserver-discussions-components-files/791/6813.model_5F00_speed_5F00_test.py
        • Run like so: ` python3 model_speed_test.py /opt/model_zoo/ONR-OD-8220-yolox-s-lite-mmdet-coco-640x640 -i /path/to/input.png `
        • Supply your own input image with -i IMAGE_NAME.png on the command line or use the default car.jpeg image
        • More options exist like setting a debug level, running on CPU, using random data, specifying a core number (for devices like AM69A with multiple accelerators). Please reference the help dialog ( -h ).
      • It expects a basic param.yaml in the model folder to designate the model name and artifacts folder. SDKs 9.0 and 9.1 had a format issue for models compiled with edgeai-tidl-tools, which this linked e2e addresses
      • This script uses a randomly initialized tensor. Replace this with an appropriately preprocessed image for the more accurate runtime results, as some layers in object detection models can have varied runtime for a high number of detections
      • Additional information is printed as a dictionary of timestamps (in nanoseconds) representing different events in the inference process. This can be visualized (functions present in edgeai-tidl-tools repo and on Model Analyzer) like so:
        • Note that this figure is generated on Model Analyzer, but was modified to be more accurate. The in/out_tensor_copy happens on the CPU. This copy latency can be mitigated with shared buffers, but this requires the C++ API’s for the deep learning runtimes (OSRT and TIDL-RT)

    2. End-to-end application: Edgeai-gst-apps

    • See SDK documentation for guidance on configuring the application. This uses a YAML configuration file, and you will need to change the model path, at a minimum
    • This has more overhead and utilization of the CPU cores, which may impact performance. The data path to and from the accelerator goes through the CPU cores, and a heavy load can result in additional delay, even though the accelerator may be completely finished processing for some time.