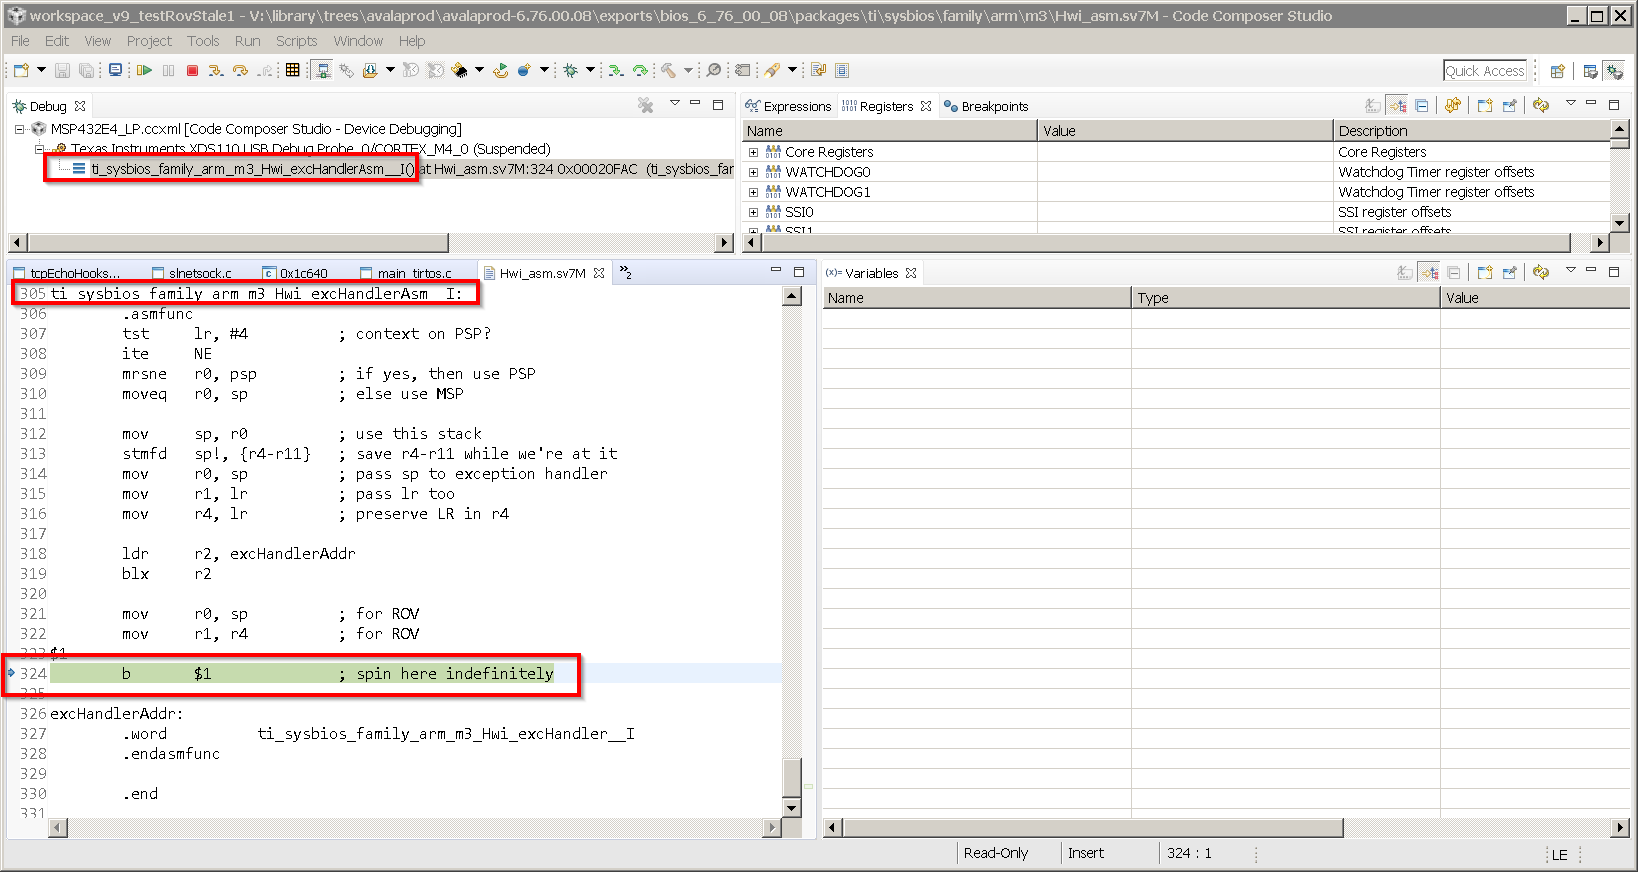
I ran my program and it seemed to "hang". When I halted it in CCS, I saw that the program was stuck spinning in an infinite loop within the following function:
ti_sysbios_family_arm_m3_Hwi_excHandlerAsm__I()
How can I find the cause of this?
This thread has been locked.
If you have a related question, please click the "Ask a related question" button in the top right corner. The newly created question will be automatically linked to this question.
I ran my program and it seemed to "hang". When I halted it in CCS, I saw that the program was stuck spinning in an infinite loop within the following function:
ti_sysbios_family_arm_m3_Hwi_excHandlerAsm__I()
How can I find the cause of this?
This is typically seen when an exception has occurred.
SYS/BIOS (TI-RTOS) provides several target unique exception handlers, which will either store or print out information about the exception that’s been detected:
ti.sysbios.family.arm.exc.Exception - used by all Arm9 and A8 targets
ti.sysbios.family.arm.m3.Hwi - used by all cortex-M3 targets
ti.sysbios.family.c64p.Exception - used by all C6x targets
The method for decoding the exception depends on the version of SYS/BIOS you are using:
Beginning with SYS/BIOS release 6.35.02.45, the various Exception modules provide an exception CallStack ROV view which can be used to view the type of exception, as well as information to find the code that caused it.
In order to use ROV, you must at minimum have CCS, XDCtools and SYS/BIOS installed. For proper version information, please refer to the "Compatibility Information" section of the SYS/BIOS release notes, and/or the documentation of your SDK.
More information on using ROV can be found here.
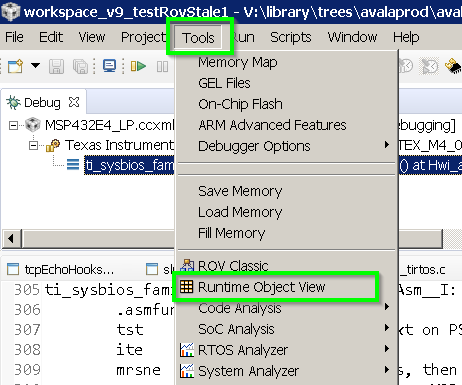
1. Once you’ve halted your application and see that the program has hit an excepton, use the Tools menu open ROV:
2. Click Connect to connect ROV to the target. ROV will then display a list of modules in the left hand side.
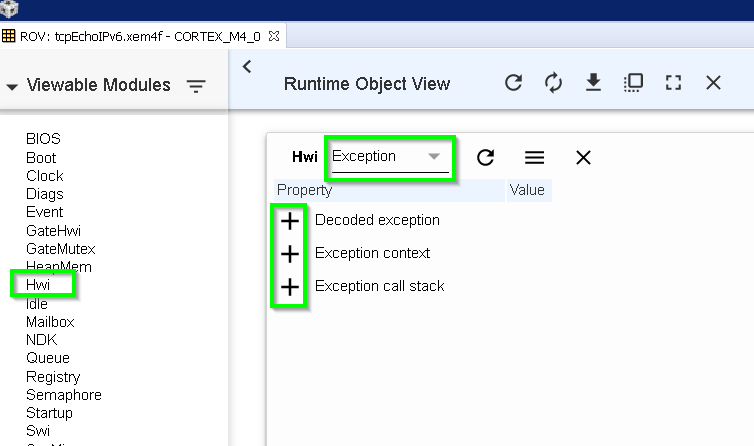
3. Click on the Hwi module to bring up the Hwi module view.
4. Select Exception from the drop down menu of the Hwi module view. You should see the following:
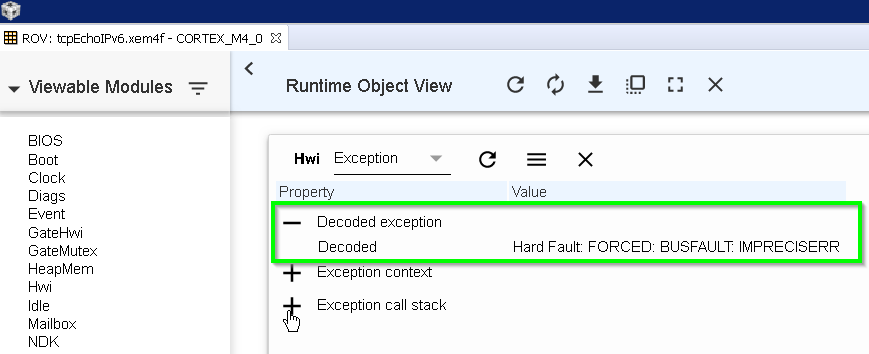
5. Click the + sign next to Decoded exception. This will display the type of exception that occurred:
6. The information of the decoded exception message can provide a clue as to the problem in the code that caused the exception.
7. Click the – sign to shrink the Decoded exception view
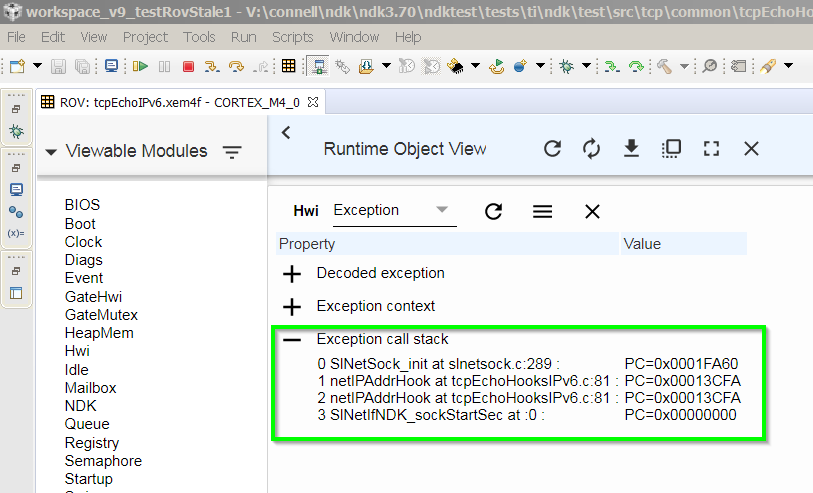
8. Click the + sign next to Exception call stack. This will display what state of the call stack was when the exception occurred:
9. The call stack information will more or less take you to the point in the code where the exception occurred. By analyzing the code at (and around) the lines shown, you should be able to find the culprit.
10. While the Exception call stack view presents a nice snapshot of where the code was when the exception happened, as well as the line numbers of related code, the CCS debugger still does not show you this same information. Thankfully, the ROV Exception view provides even more information, which can be used to sync up the CCS debugger with the call stack shown.
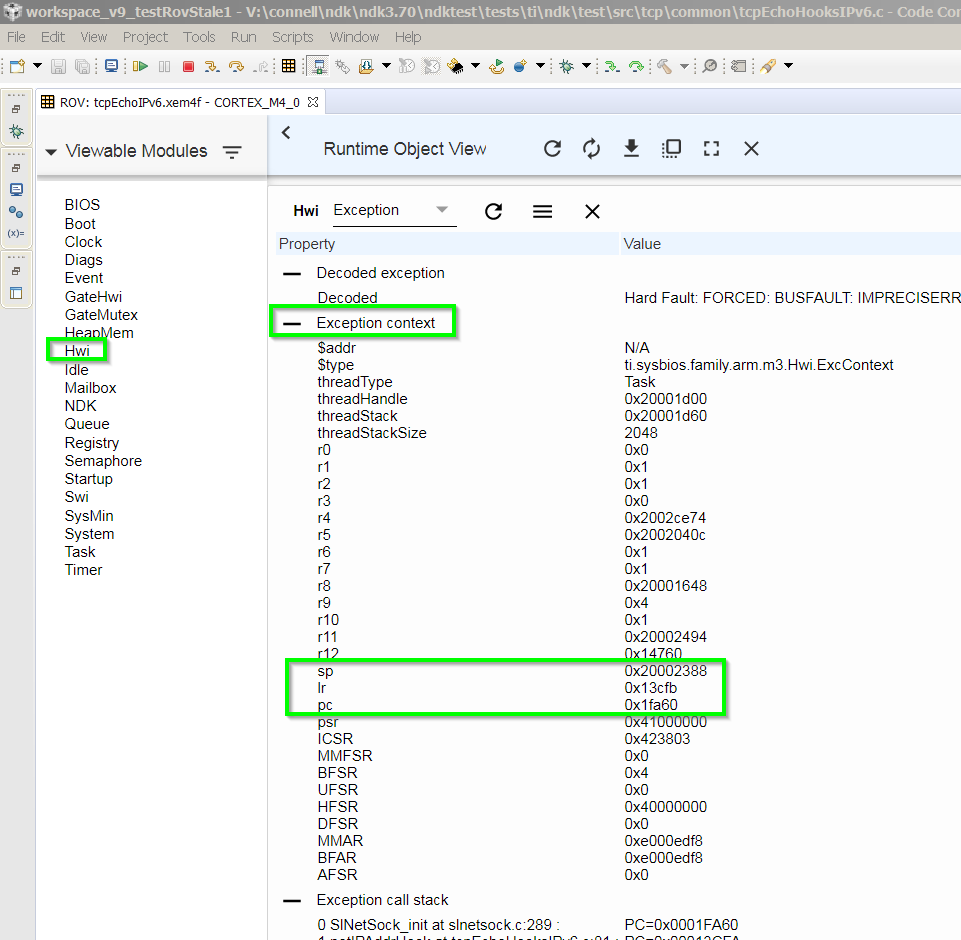
11. Click the + sign next to Exception context. This will display some information about the state of the program when the exception occurred, including the values of the CPU registers. The SP, LR, and PC registers will be used to help trace back to the exception:
12. Using the captured values of the SP, LR, and PC registers from the Exception context view, the CCS debugger can be brought into sync with the ROV Exception context view. This is done by updating these registers to have the values shown in the Exception context view. In order to do this, skip to the following step.
13. Click the – sign to shrink the Exception context view
When an exception is detected in SYS/BIOS versions 6.32.00.28 through 6.35.01.2, the exception handlers will print a complete register context dump to the CCS console. The output will look similar to the following:
ti.sysbios.family.arm.m3.Hwi: line 1095: E_hardFault: FORCED
ti.sysbios.family.arm.m3.Hwi: line 1172: E_busFault: PRECISERR: Immediate Bus Fault, exact addr known, address: ffffffff
Exception occurred in background thread at PC = 0x0001d750.
Core 0: Exception occurred in ThreadType_Task.
Task name: {unknown-instance-name}, handle: 0x20001d00.
Task stack base: 0x20001d60.
Task stack size: 0x800.
R0 = 0xffffffff R8 = 0xffffffff
R1 = 0xffffffff R9 = 0xffffffff
R2 = 0xffffffff R10 = 0xffffffff
R3 = 0xffffffff R11 = 0xffffffff
R4 = 0xffffffff R12 = 0x00000001
R5 = 0xffffffff SP(R13) = 0x20002390
R6 = 0xffffffff LR(R14) = 0x00010cf1
R7 = 0xffffffff PC(R15) = 0x0001d750
PSR = 0xffffffff
ICSR = 0xffffffff
MMFSR = 0x00
BFSR = 0x00
UFSR = 0x0000
HFSR = 0x00000000
DFSR = 0x0000000b
MMAR = 0xffffffff
BFAR = 0xffffffff
AFSR = 0x00000000
Terminating execution...
If you copy the exception dump's values for the PC, SP, (and LR for ARM targets, B3 for C6X targets) into the corresponding registers in the CCS register view, CCS will usually provide a very useful call stack back trace in the debug window.
Note: Once you have changed the values of the registers as described in the following steps, you will no longer be able to run your application.
1. Start by taking note of the register values for PC, SP, (and LR for ARM targets, B3 for C6X targets) that are shown in the exception dump.
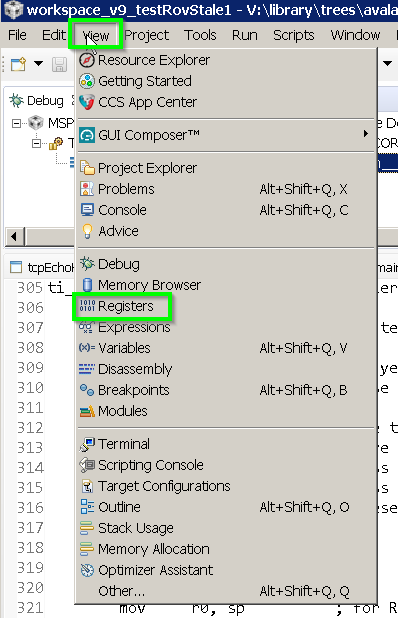
2. Open the Registers window from the View menu of CCS:
3. Once the Registers window opens, click the + sign next to Core Registers to expand the view. You will see a list of the CPU registers, including the PC, SP, and LR registers.
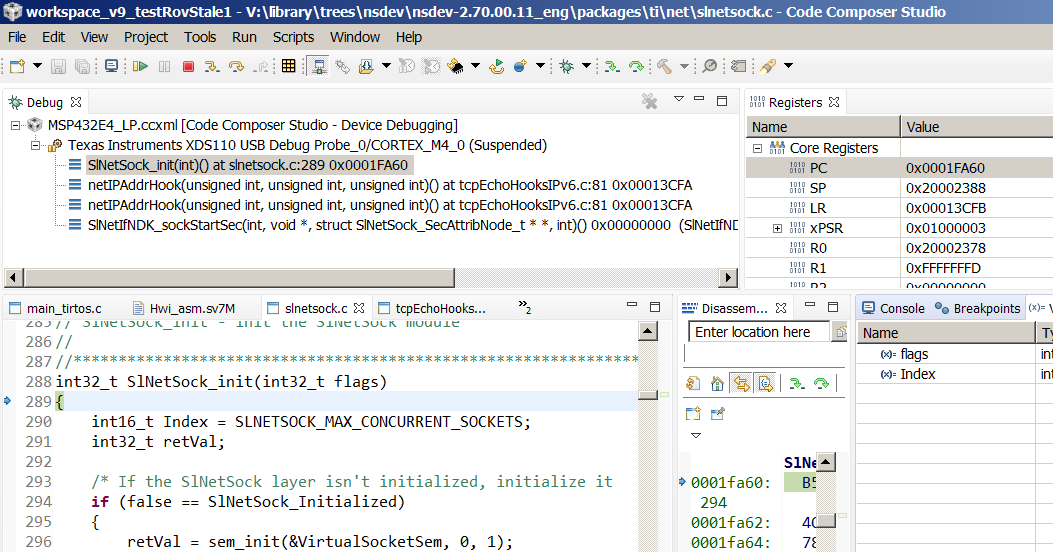
4. Update the values of the PC, SP, and LR registers in the Registers window, with the values shown in the ROV Exception context view. (Hint: copy the register values from the ROV Exception context view and paste them into the corresponding fields in Registers window.) The following screen shot shows the Registers after updating their values with those in the ROV view:
5. After updating the PC, SP, and LR registers, you will see the same call stack that’s shown in the ROV Exception call stack view, within the CCS debugger:
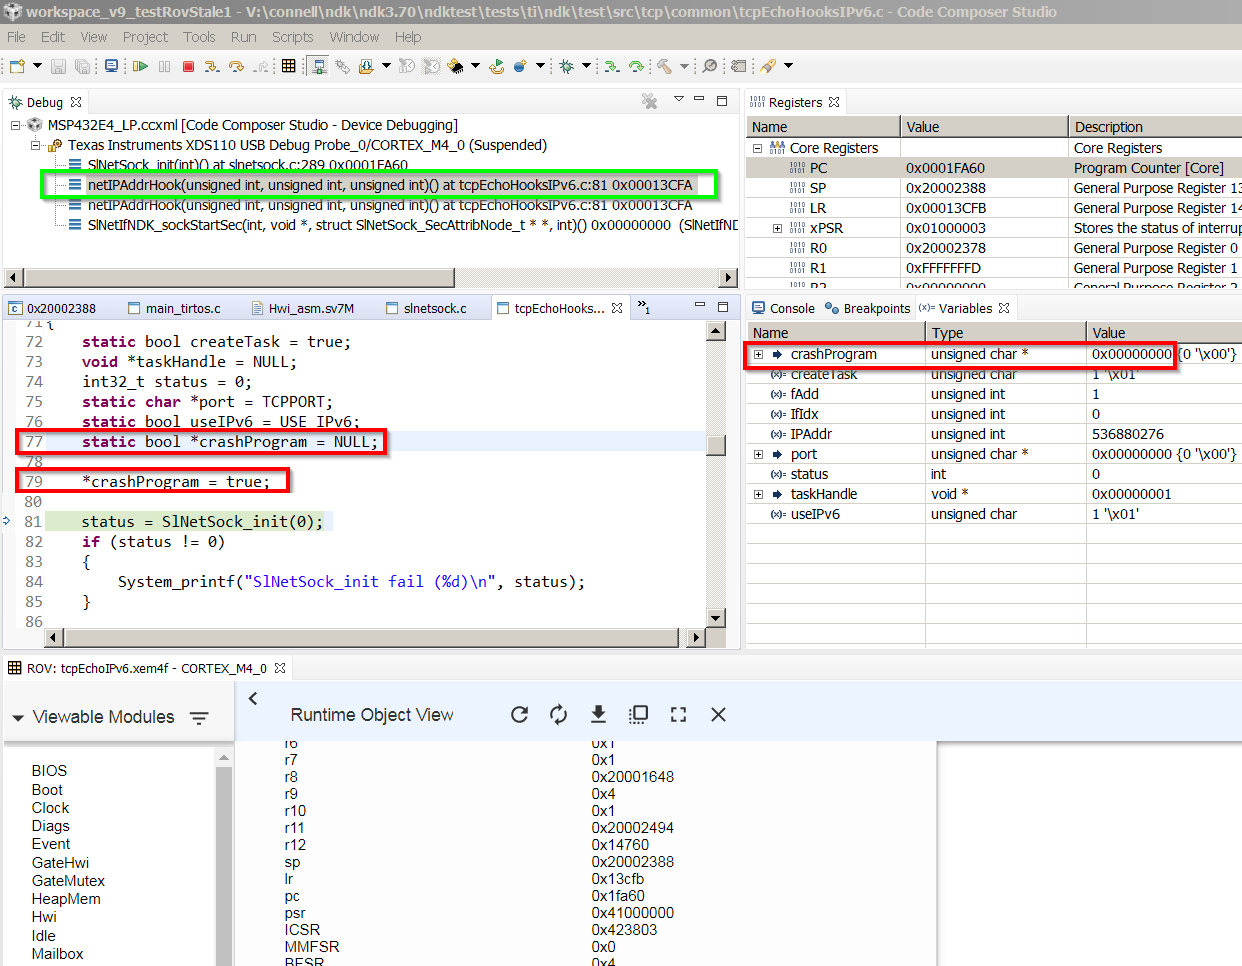
6. Take some time to explore the code that you see. Note that in the example in this FAQ, the PC is at the function SlNetSock_init(), and there doesn’t seem to be anything obvious that could have caused the application crash. After all, the program has not even entered the function yet!
7. In this case, it’s necessary to dig a little deeper, which is easier to do within the CCS debugger, now that the CPU has been brought back to the state that it was in when the crash occurred. You can now move backwards in the call stack by clicking the function names that are shown in the stack.
8. In this example, the previous location in the stack is netIPAddrHook(). By clicking on it, the debugger will jump back to the location where SlNetSock_init() was called:
9. Notice in the above screen shot that the code view has changed to a different file, with the PC at line 81 (the call to SlNetSock_init()). Now let’s inspect the code a bit more at this location …
10. Ah ha! Upon inspecting the code, we can see that just before the call to SlNetSock_init(), there is a NULL pointer dereference. We’ve now used ROV and the debugger to trace backwards to the point in the code which caused the exception.