Hi Sir/Madam,
We are using AFE7900EVM connected to ZCU102EVM through FMC connector.
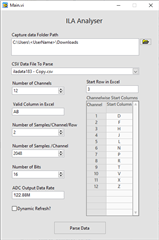
We are receiving the adc data in ILA by using the bit file shared by TI team for the requirement.
The actual data imported from ILA is attached as iladata_copy.csv and corresponding hsdc pro plotted graph is attached as below

Next , TI team had suggested to consider column D and E data as interleaved data I and column F and G as interleaved data Q. as per the suggestion please find attached interleaved I and Q data and plot as below

Ti team again asked to see data after separating 180 degree apart which we have done by interchanging i and q values which is attached as below

Kindly help us to plot the actual data and to see the actual output .Kindly share what method has to be implemented as a solution for the same.