This thread has been locked.

If you have a related question, please click the "Ask a related question" button in the top right corner. The newly created question will be automatically linked to this question.

IWR1642BOOST: People Counting Demo Crashes: Seeking Troubleshooting Methods and Diagnostic Questions

Part Number: IWR1642BOOST
Other Parts Discussed in Thread: UNIFLASH

Although my IWR1642BOOST did not have an ES2.0 sticker, the IWR1642 chip indicates it is ES 2.0.   A windows 7 box is configured with:

  • mmwave industrial toolbox 2.5.1 (requires ES2.0 IWR1642BOOST)
  • Matlab Runtime 2017a (9.2)  

    MCR_R2017a_win64_installer.exe  490156307919d5f43dd2c4764eb76c9d  

  • Uniflash 4.4.0
  • mmwave_SDK 02_00_00_04

Attempt to run C:\ti\mmwave_industrial_toolbox_2_5_1__win\mmwave_industrial_toolbox_2_5_1\labs\lab0011-pplcount\lab0011_pplcount_quickstart\pplcount_gui.exe have failed (crashed). 

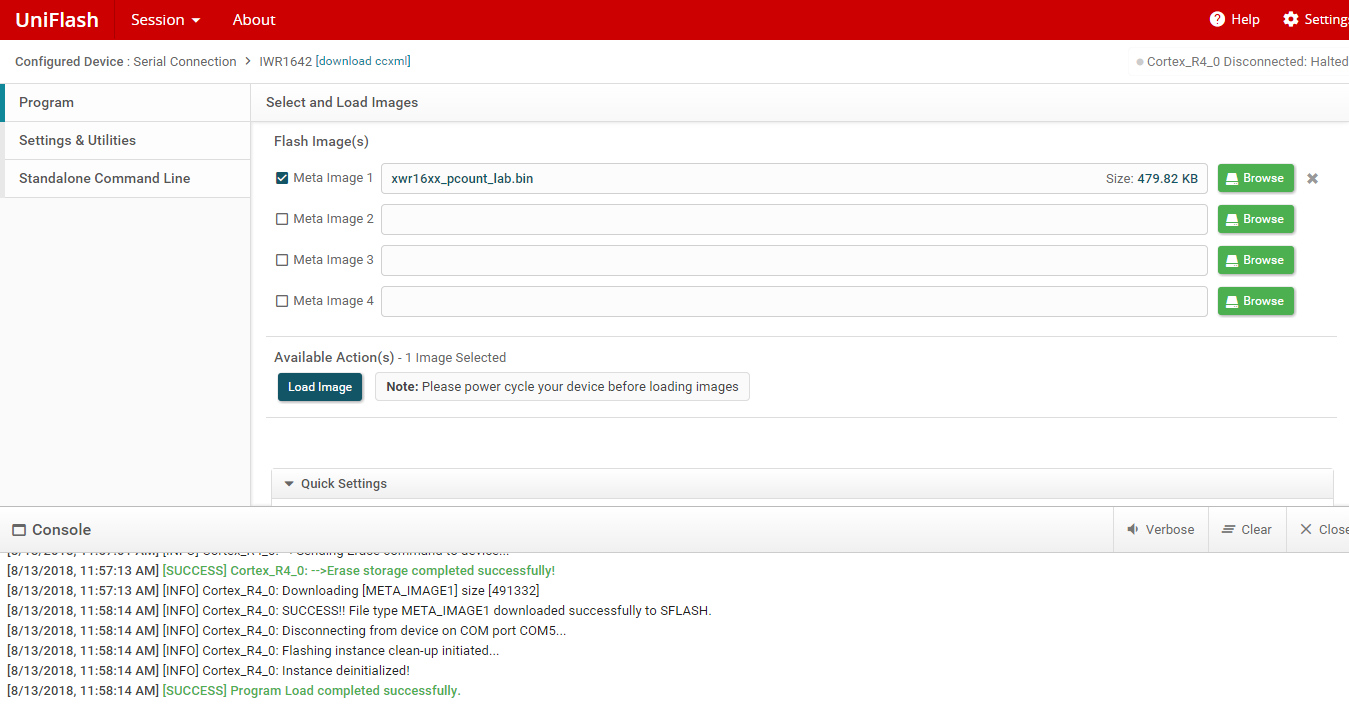
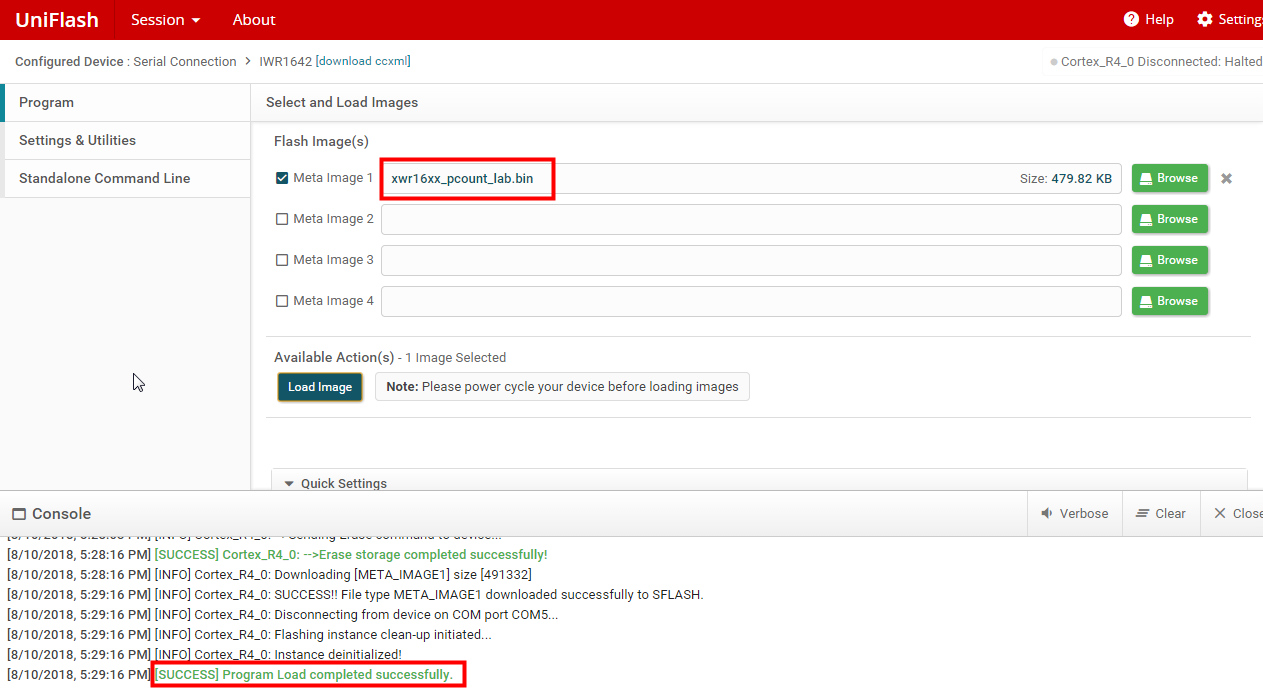
Successful Uniflash: xwr16_pcount_lab:

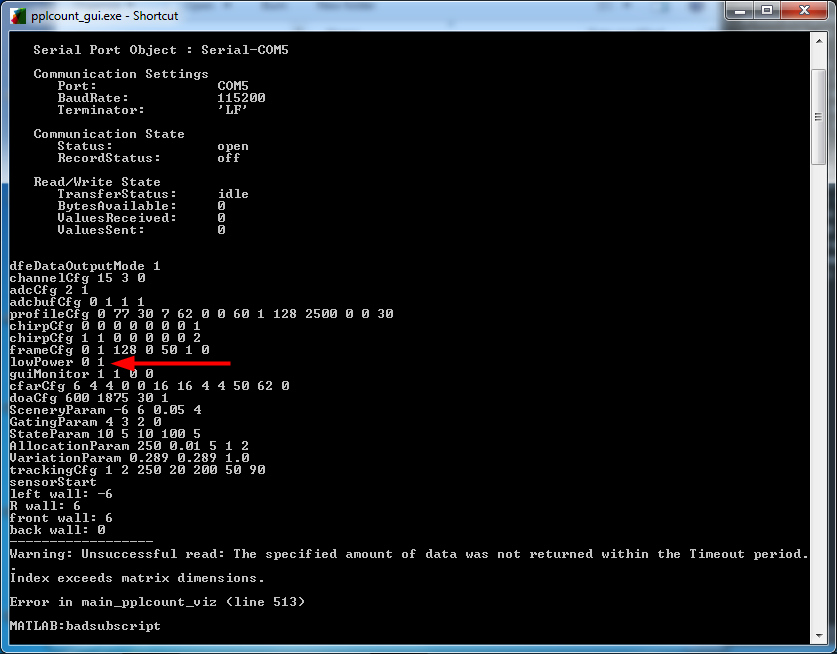
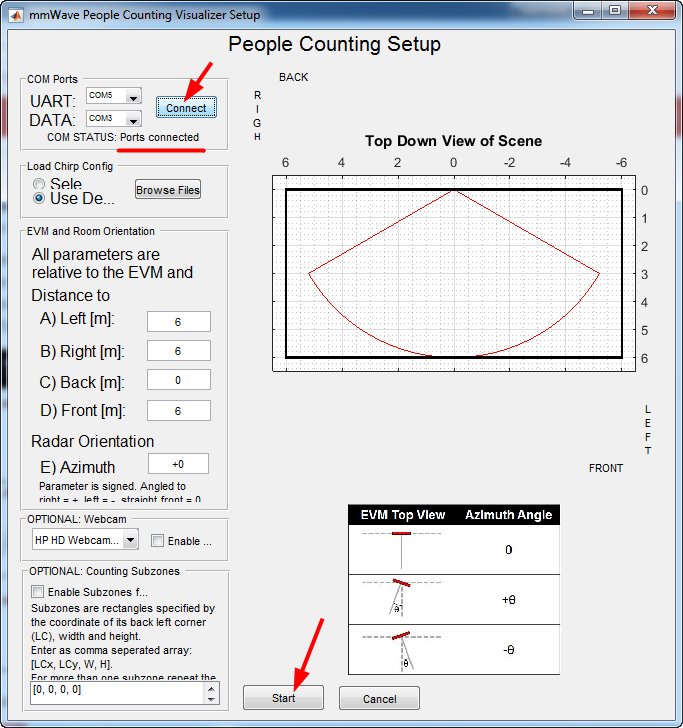
Visualizer is connected to EVM:

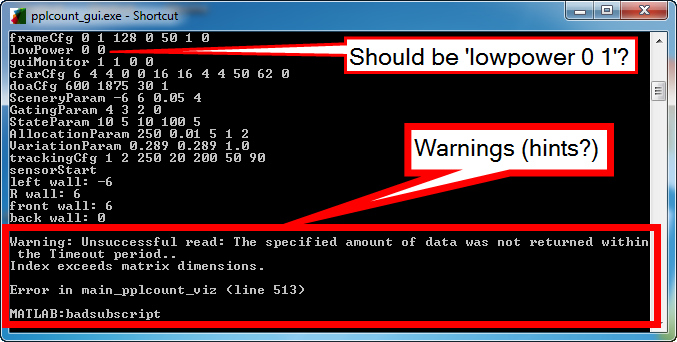
Demo error \ crash message:

What questions need to be asked to diagnose the root cause of the issue?    Looking forward to any good questions and diagnostics.

  • Raymond,

    Your question has been referred to our people counting expert. Please allow a few days for a response to your post.

    Regards,
    Kyle
  • Hi Raymond,

    It looks like there is an error in the default configuration. The ES2 devices are required to run in low power mode, so the line lowPower 0 0 should be lowPowe 0 1.  You can find other configurations in <Industrial_Toolbox_2.5.1>/chirps/images/People+Counting+and+Tracking  with the correct lowPower call.

    If this does not fix the issue we can discuss a debug plan.

    Regards,

    Justin

  • The .bin file was reflashed: C:\ti\mmwave_industrial_toolbox_2_5_1__win\mmwave_industrial_toolbox_2_5_1\labs\lab0011-pplcount\lab0011_pplcount_quickstart\xwr16xx_pcount_lab.bin

    A config file was selected from Visualizer UI:

    C:\ti\mmwave_industrial_toolbox_2_5_1__win\mmwave_industrial_toolbox_2_5_1\chirps\images\People+Tracking+and+Counting+Application\mmw_PC_6m_ConferenceRoom.cfg

    Feedback indicates the .cfg file was applied.:

    Capture before ~8 seconds before crash:

    Not sure why the configured power setting does not show: Capture just before crash:

    Questions:

    The error message indicates the application is crashing because of a timeout:: not receiving expected amount of data.  It would not surprise me that the index that exceeds the matrix dimensions, is the root cause of the problem.  

    1)  Does it make sense to troubleshoot based on the warning messages?

    2)  Did the Subject Matter Expert reproduce the warning messages? 

    3)  Is the root cause of the isssue something I have \ have not done?  Maybe there is a checklist of diagnostic questions to check my configuration \ process?

  • Hi Raymond,

    My troubleshoot procedure is below:

    The GUI first configures the device, then it waits to receive data back. This wait lasts a set amount of time, after which the GUI tries to parse the data it has received. At no point does it check to make sure the data is there, so if no data is received, the "Index exceeds matrix dimensions" error will appear. The question is: Why was no data received?

    Data is not received because the device has not sent anything. However, if the device is running, it should always send a header indicating a frame number, and the amount of data that follows. So the device probably hasn't been configured properly. After checking the configuration, I see that the lowPower value is set incorrectly. Seeing as you have used the default configuration, this seems to be an issue that will occur again, which means an update is in order.

    The comment in your second screenshot is correct, it should be lowPower 0 1.

    To address your first question, the errors Matlab gives always provide a line number. This is very useful because you can determine what is failing, and start troubleshooting/debugging from that point.

    Regards,
    Justin
  • Thanks for explanation: the utility of responses is improving.

    A config file was selected from Visualizer UI:

    C:\ti\mmwave_industrial_toolbox_2_5_1__win\mmwave_industrial_toolbox_2_5_1\chirps\images\People+Tracking+and+Counting+Application\mmw_PC_6m_ConferenceRoom.cfg

    dfeDataOutputMode 1
    channelCfg 15 3 0
    adcCfg 2 1
    adcbufCfg 0 1 1 1
    profileCfg 0 77 30 7 62 0 0 60 1 128 2500 0 0 30
    chirpCfg 0 0 0 0 0 0 0 1
    chirpCfg 1 1 0 0 0 0 0 2
    frameCfg 0 1 128 0 50 1 0
    lowPower 0 0
    guiMonitor 1 1 0 0
    cfarCfg 6 4 4 0 0 16 16 4 4 50 62 0
    doaCfg 600 1875 30 1
    SceneryParam -6 6 0.05 4
    GatingParam 4 3 2 0
    StateParam 10 5 10 100 5
    AllocationParam 250 0.01 5 1 2
    VariationParam 0.289 0.289 1.0
    trackingCfg 1 2 250 20 200 50 90
    sensorStart


    QUESTIONS

    Is said .cfg file intended for the people counting exercise? If not, please advise the path\filename.  

    Did the SME provide an explanation as to why the power setting cause a failure to return data?

    Thanks,
    Raymond

  • Hi,

    I am also facing the same problem.

    Please let me know if you get anything concrete on the issue. A few days back it was working perfectly but since last 2 days, it is creating a problem. I have not changed anything on my computer or CCS. 

  • Interesting Laxmi. Although we are both using  mmwave industrial toolbox 2.5.1, your visulaizer app worked at one time.

    @Laxmi, can you post your .cfg file at the bottom of your original post?  I'd like to compare yours with my default.cfg file.  I have posted my setting above in a previous post.

  • Hi Raymond and Laxmi,

    In both of your screenshots, the Power mode is incorrect. Low power mode needs to be enabled, or the device will not run.  Please change the configuration to lowPower 0 1.

    ES2.0 devices only work in low power mode, however, the option is still present in the SDK to run in either low or high power mode. 

    Regards,

    Justin

  • Hi Raymond,

    This file is intended for People Counting, but the power mode has not been updated. Please edit the file to change the power mode. See my other response to understand why the device needs to be in low power mode.

    Regards,
    Justin
  • .cfg Power setting was update and uploaded to EVM.  Visualizer crashes.  Error messages and confirmation of 'lowpower' settings:

    What other steps \ actions should be tried to successfully run the people counter demo?

  • Hi Raymond,

    Did you power cycle the device before sending the configuration?

    Assuming that does not fix the problem,
    We need to determine if the device is sending any data. Do you have a Serial port interface like Tera Term or putty that you can connect to the serial port after the Matlab script crashes? A crash at line 513 is usually due to lack of data coming from the device. If you can connect to the serial port with something besides Matlab, we can confirm that there is no data coming from the device.

    Are you running the pre-compiled binary, or are you using a binary you compiled? This configuration works on my end with the pre-compiled binary. If you have compiled the binary yourself, there may be some error in the compilation process that is causing an issue.

    Regards,
    Justin
  • Hi Raymond,

    Is your issue resolved?

    Regards,
    Justin
  • Attempts to perform the above suggestions have failed.   Yes,  The Uniflash instructions indicate that after a successful flash to Power off the board and remove the SOP2 jumper.  I reperformed the entire exercise (starting with flashing the TI compiled binary) and reset the EVM with SW2 (in yellow box), just before sending the .cfg file from the visualizer.   

    Only TI pre-compiled binaries are used.  I have not compiled any binaries for the EVM.

    Serial monitoring programs (Termite \ Putty) do not show activity on the COM5. After flashing, removing power + SOP2 jumper, and rebooting, should I expect the EVM to return data that woudl be visible on Putty \ Termite?  Or does the configuration file and start need to be invoked first?   What should the serial port settings be?  I tried representatives setting of 9600 and 115,2K

  • Hi Raymond,

    Thank you for providing very detailed reports of what you have done.

    The EVM will not send data until the configuration is sent to the device. After configuration, the device will continuously send data every frame, assuming it is functioning properly. Because the data is in TLV format, it will look like garbage on the terminal monitoring software, however you will be able to confirm that data is being sent over. The baud rate for this data is 921600.

    You can also send the configuration to the device without using the GUI, if you open another terminal and connect it to the UART port. Then use this terminal to send the configuration.

    UART Baud Rate is 115200
    DATA Baud Rate is 921600

    You will want to start the GUI after power cycling the device. So power cycle the board, launch the GUI, connect to the COM Ports, then send the modified configuration with lowpower 0 1.

    Regards,
    Justin
  • Justin,

    We have tried these diagnosis / corrections to address the people-counting visualizer crash:

    1. Updating the  configuration file with updated low power settings
    2. "listening" for data with terminal programs (Putty \ termite)

    The tests indicate the TLV data is not being sent by the device.  Is there any other tests to perform or is it time to RMA the EVM?

    Thanks,

    Raymond

  • Hi Raymond,

    I will ask you to try to run the Out of Box demo, available with the mmWave SDK, before deciding that the board is faulty. If the Out of Box demo does not run on SDK 2.0.0.4, please try running the Out of Box demo with SDK 1.2.0.5.

    Regards,
    Justin
  • Hi Raymond,

    Can you confirm that the Out of Box demo does not work with either SDK 2.0.0.4 or SDK 1.2.0.5?

    Regards,
    Justin
  • Yes: Out of Box demo does not work with either SDK 2.0.0.4 or SDK 1.2.0.5
  • Hi Raymond,

    From the error shown in your previous post on running the Out of Box Demo, the analog Monitor configuration is failing. When running the OOB on SDK 2.0.0.4, did it show the same error as the one you posted here

    These errors give line numbers, which allow the user to debug the demo by checking the source code at that line to determine why the error was thrown. 

    Regards,

    Justin

  • Hi Justin,

    The OOB demo SDK 2.0.0.4 observations are posted at https://e2e.ti.com/support/sensor/mmwave_sensors/f/1023/t/717129

    The EVM is no longer in my custody and I am unable to perform any more tests.   That being said, it is interesting that the line numbers provide insight as to the source code line to be inspected for errors: I did not compile any code and flashed only the TI provided .bin files (KISS principle).

    Your diligence is appreciated.

    Thanks,

    Raymond

  • Hi Raymond,

    As the EVM is no longer in your custody, will you require further support on this thread?

    Regards,
    Justin