This thread has been locked.

If you have a related question, please click the "Ask a related question" button in the top right corner. The newly created question will be automatically linked to this question.

PGA460-Q1: some issues

Part Number: PGA460-Q1
Other Parts Discussed in Thread: PGA460

Hi team,

I am not familiar with PGA460-Q1, could you help resolve the following issues for the customer by any chance?

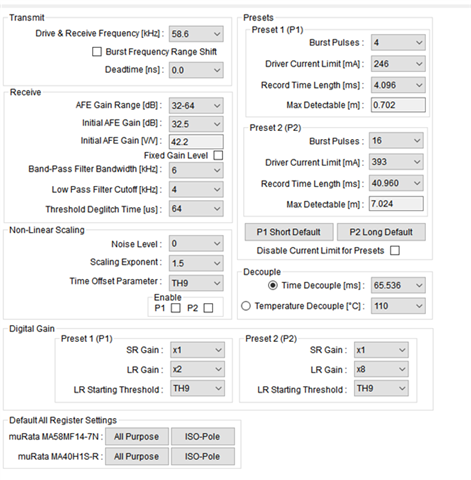
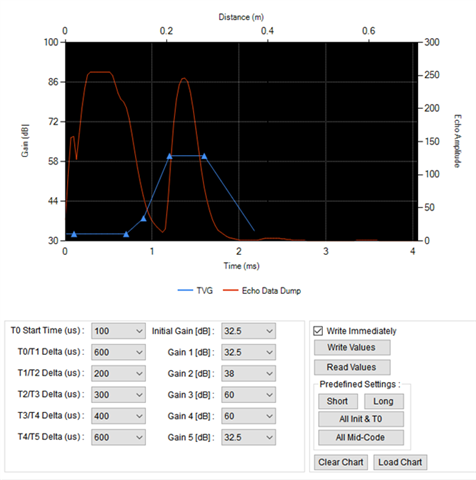
Now, one of our customers debugs with TI’s EXP430F5529LP + PGA460 mother board + PGA460 daughter card, and after adjusting the Time Varying Gain, the Data Monitor window screenshot is as follows:

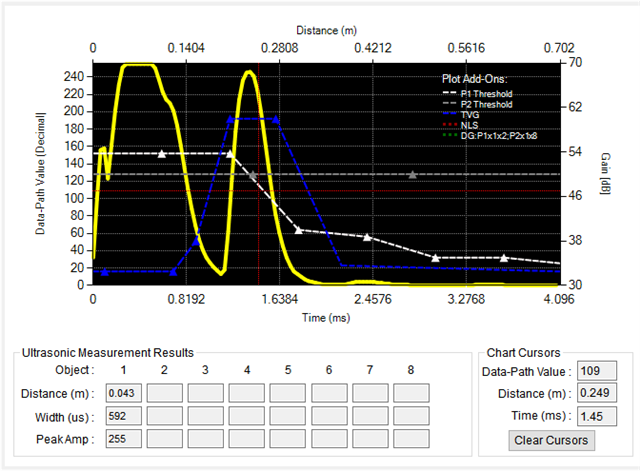
What causes the left half of the yellow waveform to be wide? It's difficult to change its width. Is its width the time width of the transmitted wave? How can I adjust it to narrow it?

How can I adjust to detect objects within 20cm?

Best Regards,

Amy Luo

  • Hello Amy,

    Thank you for the question. This behavior is typical for a monostatic topology for an ultrasonic sensor. What you are seeing on the left peak of the yellow waveform is the the actual transmission of the ultrasonic pulse and what is also known as its ringdown, which is mechanical ringing of the transducer once the excitation ends.

    There are some techniques that can be used in order to decrease the width of the left peak, such as reducing the number of pulses transmitted and other methods can be used to reduce the ringing of the transducer after the emission  occurs.

    The best way to reduce it as much as possible is to setup the device in a bistatic configuration instead of using monostatic. This will use one transducer to produce the soundwaves and the second transducer will be listening. This will allow for the customer to get very close distances essentially near zero measurements.

    This document contains good information on various ultrasonic sensing basics as well as the different configurations that I spoke about above and transducer ringing: www.ti.com/.../slaa907c.pdf

    I hope this helps!

    Best,

    Isaac

  • Hi Isaac,

    It’s useful, Thanks for your information.

    The customer has the following additional questions. Could you help analyze the cause by any chance?

    The echo just measured has two peaks at a certain distance, and the lower peaks appear to the left or right of the main wave, depending on the difference and distance set by T4 in the tvg. See figure:

    The Distance(m) in Chart Cursors in the GUI is not displayed correctly:

    The distance in the Ultrasonic Measurements Results does not change:

    Thanks,

    Amy

  • Hello Amy,

    The two waves could be a result of a couple of things, if there were two targets then one closer than the other it could have caused this issue or sometimes it could be the angle. If the Ultrasonic wave bounced off of an angle and returned to the transducer it would be determined as another event.

    The reason the even is not being showed correctly in the ultrasonic measurements results portion of the tab is because the customer needs to ensure that they correct their thresholding. The threshold is being triggered during the ringing period of the transmission so they need to increase the time of the threshold.

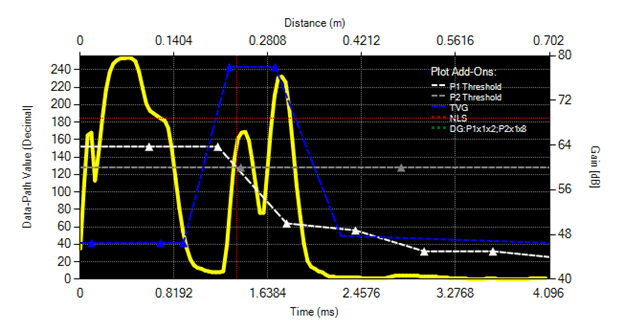
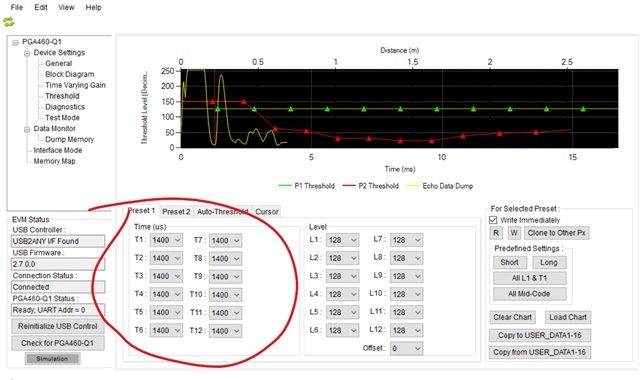
     \If they set the time for the threshold past the time of the ringing period then this will correct this issue.

    Best,

    Isaac