This thread has been locked.

If you have a related question, please click the "Ask a related question" button in the top right corner. The newly created question will be automatically linked to this question.

IWR6843 uses VitalSignsRadar_Demo gui, but the device is not open

Other Parts Discussed in Thread: IWR6843ISK, UNIFLASH, IWR6843

Dear TI ,

We use IWR6843ISK EVM (PROC073D(001_IWR)_Sch) for Flashing mode and function mode operation.

SOP control switch (flashing mode): s1.1 on, s1.2 off, s1.3 on, s1.4 on, s1.5 off
Use UniFlash to download the bin file, switch s1.1 to off (Functional mode) after success,

Plug in the USB again, use VitalSignsRadar_Demo to test the RADAR Demo, find it in the Log in the DOS window :

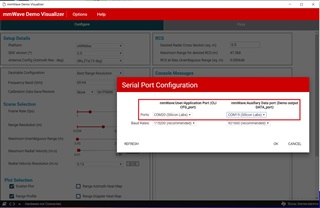
The user port and data port can be identified, the data port is opened successfully, and the user port is opened successfully.

But QIODevice :: Write(QSerialPort): device is not opened.

Total payload size from the UART is: 252

Padding factor is: 8

Total payload size from the UART is: 256

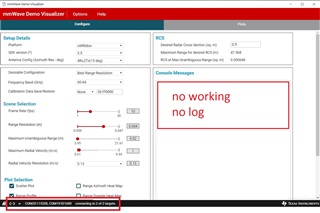
Than Stop all reactions. No further steps are shown.

Please help us find out what happened.

  • Hi. TI ,

    SOP control switch level in IWR6843

    s1.1, s1.2, s1.3 are float or pull high 3.3V.

    Is this floating point status correct? It does not need to be connected to GND?

    s1.4, s1.5 are float or pull low GND

    Is this floating point status correct? It does not need to be connected to 3.3V?

  • Hello

    Can you please confirm that you are able to run the OOB demo for the EVM. THis will confirm that your board and setup are working correctly.

    Thank you,

    Vaibhav

  • Hi,Vaibhav .

    We have entered the trial production stage. After verifying all PCBAs, we found that almost half of them failed. .

    We can use Uniflash to download the bin file and run mmWAVE Visualizer and vital_signs,
    The UI waveform is normal. The function is operating normally.

    But some PCBAs can use Uniflash to download bin files, but vital_signs seems to stop when running mmWAVE Visualizer.

    It doesn't seem to be started, and there is no data output from the UART.

  • Hello Andy,

    Just so I understand the problem correctly, can you confirm the below statement?

    You have a custom PCB design and all boards can be programmed using uniflash. Some boards boot and run the demo and visualizer ok, but some boards do not start. Or is it that all boards do not start?

    Either way, can you start the sensor in debug mode to see if there are any errors output when starting. Try this with a good board and a bad board. This should tell you if there is an issue with the board.

    Using CCS Debug for Development

    Regards,

    Jackson

  • Hi. Jackson.

    70% of our PCBA works normally, and 30% downloads are normal but not working.

    The list is the 68xx_vital_signs log. Can it find any problems knowing we need to debug or fix it?

    ----------------------------------------

    Welcome to TI's wonderland!!

    QT version = 5.12.11
    Serial Port Found
    Data Port Number is "COM23"
    User Port Number is "COM22"
    Data port succesfully Open
    User port succesfully Open
    Configuration File Name Read from the GUI is "xwr1642_profile_VitalSigns_20fps_
    Back.cfg"
    QMetaObject::connectSlotsByName: No matching signal for on_buttonBox_accepted()
    ""
    Configuration File Path is "C:/Users/asus/Desktop/1200/mmwave_industrial_toolbo
    x_4_8_0__all/mmwave_industrial_toolbox_4_8_0/labs/vital_signs/68xx_vital_signs/g
    ui/profiles/xwr1642_profile_VitalSigns_20fps_Front.cfg"
    "sensorStop"
    "flushCfg"
    "dfeDataOutputMode 1"
    "channelCfg 15 3 0"
    "adcCfg 2 1"
    "adcbufCfg -1 0 0 1 0"
    "profileCfg 0 60.25 7 6 57 0 0 65 1 200 4000 0 0 40"
    "chirpCfg 0 0 0 0 0 0 0 1"
    "frameCfg 0 0 2 0 50 1 0"
    "lowPower 0 1"
    "guiMonitor 0 0 0 0 1"
    "calibDcRangeSig -1 0 0 0 0"
    "vitalSignsCfg 0.3 0.9 256 512 4 0.1 0.05 100000 300000"
    "motionDetection 1 20 2.0 0"
    "sensorStart"
    ""
    stratFreq_GHz: 60.25
    freqSlope_MHZ_us: 65
    numSamplesChirp: 200
    samplingRateADC_ksps: 4000
    rangeStartMeters: 0.3
    rangeEndMeters: 0.9
    AGC_thresh: 4
    Chirp Duration in us is : 50
    Chirp Bandwidth in kHz is : 3250
    Maximum Range in Meters is : 9.23077
    numRangeBinProcessed: 17
    Total Payload size from the UART is : 252
    Padding Factor is : 8
    Total Payload size from the UART is : 256

  • Hello,

    If only 30% of the sensors are not starting, it seems there is a HW issue. This can be more difficult to debug. Please go through the new HW checklist with one of the non-working PCBs to see if you can identify a problem.

    https://www.ti.com/lit/zip/swrr161

    Also, this log will only output from the GUI. Please run the sensor in CCS debug mode to see if there are any errors generated from the non working board at startup, this is likely where you will find the issue.

    Using CCS Debug for Development

    Regards,

    Jackson

  • Hi. Jackson.

    We capture mmWave Demo Visualizer usage

    Pic1 and Pic2 are not working PCBA , 

    Pic1 : Serial Port Configuration is normal .

    Pic2 : In pic2 setup and connecting are normal , but no working no log

    In pic3 and pic4 are normal PCBA , working normal and have log .

    Pic3

    Pic4

    Please help us any command or suggestions .

  • Hi Andy,

    It seems there is an issue with the data UART port connection. Before we dive into HW debug of the port, can you use CCS to connect, load, and run the program from the link above? This will tell us if there are any software errors.

    Also, if you connect to the CFG port (COM20) with teraterm or putty or some serial terminal, you should be able to see the CLI printout mmwaveDemo>> on the screen and it will echo what you type. This would confirm if the device is running and started normally in addition to the CCS debug.

    Regards,

    Jackson