Other Parts Discussed in Thread: DCA1000EVM
Dear enginner,
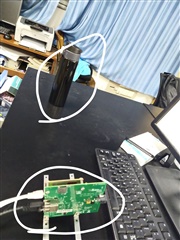
I used IWR1443BOOST+DCA1000EVM+ mmwave studio to observe a steel water bottle 0.4 meters away from the radar.

The configuration of frame and chirp is shown as follows:
I captured 8 frames data and used matlab script rawDatareader.m to parse adc_data.bin and got radarCube.mat. Then I conducted an FFT process on the data of the first frame, the first antenna and the first chirp, and got the spectrum graph as shown in the figure below:
Unfortunately, what I got was this messy picture. I followed the TI training course:
https://training.ti.com/sites/default/files/docs/mmwaveSensing-FMCW-offlineviewing_0.pdf
Can you tell me the reason? How can I improve my practice?

