This thread has been locked.

If you have a related question, please click the "Ask a related question" button in the top right corner. The newly created question will be automatically linked to this question.

IWR6843AOPEVM: Coordinates of detected objects relative to device

Part Number: IWR6843AOPEVM


Hello,

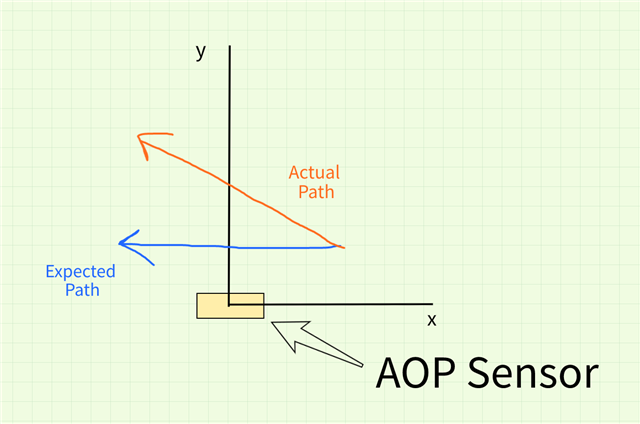
My team recently ran an experiment with the OOB demo. We set up the sensor on a desk with the front face (see image 1) facing outward toward the room. We then had a person walk from one side of the room to the other in front of the sensor. We captured the point-cloud data using a Python script, and then plotted the x and y data. The sensors were able to pick up the person's movement, put not in the direction expected. Instead of traveling in front of the sensor at a constant y value, the data shows the person traveling at an inclined path on the xy-plane (see image 2). 

I'm a bit confused on where this difference is coming from. Is there a diagram somewhere showing where the origin and x, y, and z axes are relative to the physical device?

  • Hello,

    Can you please share which version of the SDK and the Industrial Toolbox you are using along with the binary file and configuration file being used to run the EVM? Can you also confirm that your board is positioned similarly to the photo attached with the board at a 90 degree angle with the ground?

    Millimeter Wave (mmw) Demo for XWR68XX -- here is a document which can be found at C:\ti\mmwave_sdk_03_05_00_04\packages\ti\demo\xwr68xx\mmw\docs\doxygen\html\index. Under "Output information sent to host" you may find more information on the outputs you are gathering.

    We also suggest running this OOB demo with our OOB demo GUI visualizer (open in chrome: https://dev.ti.com/mmWaveDemoVisualizer) and seeing if you have the same x,y data problem.

    Sincerely,

    Angie

  • Hi Angie,

    We are using version 03_05_00_04 of the SDK, and version 4_8_0 of the Industrial Toolbox. The binary file is the one that is pre-loaded on the device, we did not flash a different binary file to the device. The config file used was:

    % ***************************************************************
    % Created for SDK ver:03.05
    % Created using Visualizer ver:3.5.0.0
    % Frequency:60
    % Platform:xWR68xx_AOP
    % Scene Classifier:best_range_res
    % Azimuth Resolution(deg):30 + 30
    % Range Resolution(m):0.044
    % Maximum unambiguous Range(m):9.02
    % Maximum Radial Velocity(m/s):1
    % Radial velocity resolution(m/s):0.13
    % Frame Duration(msec):100
    % RF calibration data:None
    % ***************************************************************
    sensorStop
    flushCfg
    dfeDataOutputMode 1
    channelCfg 15 7 0
    adcCfg 2 1
    adcbufCfg -1 0 1 1 1
    profileCfg 0 60 359 7 57.14 0 0 70 1 256 5209 0 0 158
    chirpCfg 0 0 0 0 0 0 0 1
    chirpCfg 1 1 0 0 0 0 0 2
    chirpCfg 2 2 0 0 0 0 0 4
    frameCfg 0 2 16 0 100 1 0
    lowPower 0 0
    guiMonitor -1 1 1 0 0 0 1
    cfarCfg -1 0 2 8 4 3 0 15 1
    cfarCfg -1 1 0 4 2 3 1 15 1
    multiObjBeamForming -1 1 0.5
    clutterRemoval -1 0
    calibDcRangeSig -1 0 -5 8 256
    extendedMaxVelocity -1 0
    lvdsStreamCfg -1 0 0 0
    compRangeBiasAndRxChanPhase 0.0373302 0.48428 -0.21729 -0.43369 -0.29611 -0.08438 -0.20163 0.65515 0.75549 0.26181 -0.13647 -0.25119 0.02075 -0.25217 -0.48068 -0.56903 0.11343 -0.21069 -0.55200 -0.07471 0.65201 -0.16562 -0.10986 0.21133 0.22296
    measureRangeBiasAndRxChanPhase 0.0 1.0 0.2
    CQRxSatMonitor 0 3 5 121 0
    CQSigImgMonitor 0 127 4
    analogMonitor 0 0
    aoaFovCfg -1 -90 90 -90 90
    cfarFovCfg -1 0 0 8.92
    cfarFovCfg -1 1 -1 1.00
    calibData 0 0 0
    sensorStart

    Thank you for the link to the documentation, I'll review that. We'll also try comparing results using the demo visualizer.

  • I'm having trouble visualizing the comparison between the axes in the documentation and the AOP antenna positions. Can you review the axes (where the y axis is going into and out of the image) that I drew over the figure and confirm if they look correct?

  • Hello,

    Your axes drawn on the image above are correct along with your expected path. Thank you for sharing your config file.

    Here are the toolbox instructions for the OOB demo for reference: https://dev.ti.com/tirex/explore/node?node=AIHy77joqu3jXFmjqwkBKQ__VLyFKFf__LATEST 

    Have you ran into any issues running the device with the OOB demo GUI visualizer (open in chrome: https://dev.ti.com/mmWaveDemoVisualizer)? Does the same x,y data problem persist in this visualizer? 

    Sincerely,

    Angie

  • We ran into some unrelated issues when trying the demo visualizer, we will try to test the OOB demo GUI visualizer test tomorrow and I'll update with the results.

    Thanks