


Other Parts Discussed in Thread: IWR1642, IWR1443
I am testing High accuracy Level Sensing with the iwr1642 EVB.
I have a question while analyzing the protocol output to the serial port.
For protocol analysis, the DataStructure table higAccuLab was referred to.
I'm trying to make software that displays graphs in visual C# like High Accuracy Visualize.
But I can't figure out how the Range Profile is configured
For example, the Range Profile information output from the iwr1443 EVB can understand the information provided by the DataStructure table higAccuLab, so graph software was developed.
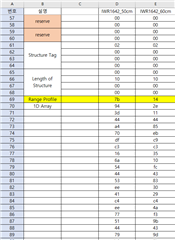
However, iwr1642 EVB Range Profile information cannot be understood.
For example, I cannot understand whether 2 bytes represent 1 coordinate or 4 bytes represent 1 coordinate.
Please tell me how to analyze the coordinate information to display the iwr1642 EVB Range Profile as a graph.
