This thread has been locked.

If you have a related question, please click the "Ask a related question" button in the top right corner. The newly created question will be automatically linked to this question.

MMWCAS-RF-EVM: Confused about RF board frame/coordinate definition on post-processed data with default cascaded MIMO configuration

Part Number: MMWCAS-RF-EVM
Other Parts Discussed in Thread: AWR2243

Hello,

I was using default MIMO LUA files (Cascade_Configuration_MIMO.lua and Cascade_Capture.lua) to capture some raw data. Antenna calibration was done before I captured the raw data. 

From the post-processed plots with cascade_MIMO_signalProcessing.m, I was confused about the frame/coordinate definition of the RF board. 

(1) Here is my setup.
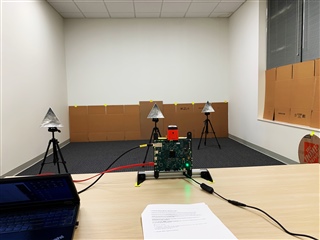
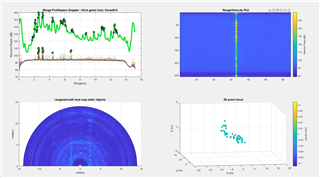
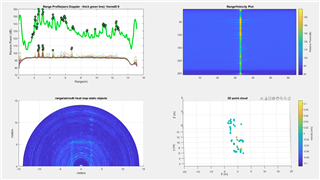
(2) Here are the plots after post-processing with cascade_MIMO_signalProcessing.m
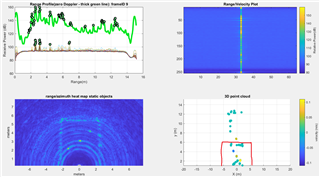
From the "range/azimuth heat map static objects" plots, they make sense to me. The heatmaps can basically detect all strong reflectors and roughly detect the shape of the room. 

However, the "3D point cloud" plots didn't make sense to me. For example, on the x-y plane, the detected strong reflectors had wrong orientations. 

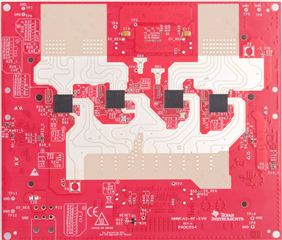
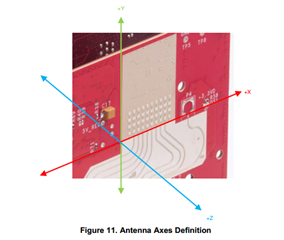
Also, from the frame definition of "AWRx Cascaded Radar RF Evaluation Module.pdf", the plots used different coordinate definition. 
So I have two questions/confusions here. 

(1) What is the frame definition that cascade_MIMO_signalProcessing.m used. Roughly I can see, Z is up, Y is forward and X is to the right. If so, where is the origin of this frame definition on the RF board?

(2) From the plots, why the "3D point cloud" plot are inconsistent with the "range/azimuth heat map static objects" plots?

Thank you very much for the help!

Best,

Hang

  • Hello Hang, 

    Thankyou for reaching out. Please give us some time to analyze your concern and get back. 

    Regards,

    Ishita

  • Hi,

    Please find my responses below.

    1. What is the frame definition that cascade_MIMO_signalProcessing.m used. Roughly I can see, Z is up, Y is forward and X is to the right. If so, where is the origin of this frame definition on the RF board?

             Ans:    The origin is the phase center of the TX/RX antenna array. After calibration, the origin is the “0” angle defined by the calibration target but at zero distance.

            2. From the plots, why the "3D point cloud" plot are inconsistent with the "range/azimuth heat map static objects" plots?

            Ans:      The detected point in the point cloud should be consistent with heat map. However, the detection algorithm might not be able to detect all the points that human eye can select. You need to play with the detection threshold to optimize the performance.

    Regards

  • Hi Abhed,

    Thank you very much for reply. 

    (1) I still confused about "The origin is the phase center of the TX/RX antenna array." Could you point me out the origin of the RF board after calibration?

    (2) I agree that the heatmap should be consistent with the point cloud plots. I have two more questions/confusions here. 

    a) which parameters I should tune for optimizing the threshold?

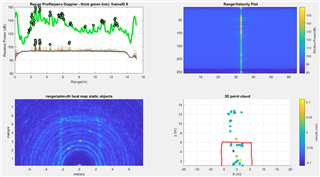
    b) From the plots below, the point could plot seems to be a mirror of the heat map plot. Don't you think so?

    Thank you very much for your help!

    Best,

    Hang

  • Hi,

    1. The antenna axis definition is given in the figure 11.

    2. You will have to refer the example codes for AWR2243 running on host. As the detection algorithm is going to run on host.

    Regards

  • Hi Abhed,

    Thank you for reply. 

    From my first post, for the point could plots, it is apparently that the forward is +Y. However, in figure 11, the forward is +Z. 

    It confuses me. Could you explain it a little bit?

    I will take a look of the code for detection algorithm. 

    Thanks!

    Best,

    Hang

  • Hi,

             The section 2.6 in the EVM user guide does explain the x, y and z and also polarization side.

    Regards

  • Hi Abhed,

    Thanks. I did read the user's guide section 2.6 here

    My question/confusion is that the coordinate definition on section 2.6 is not consistent with the point cloud plot processed by cascade_MIMO_signalProcessing.m

    That's why I was asking. 

    Best,

    Hang

  • Hi,

            Apologies for the confusion. Yes, the y and z is reversed in the doc comparing to the plot. 

    Regards