This thread has been locked.

If you have a related question, please click the "Ask a related question" button in the top right corner. The newly created question will be automatically linked to this question.

IWR6843ISK: 1D FFT data location in UART Data

Part Number: IWR6843ISK

Hi Team,

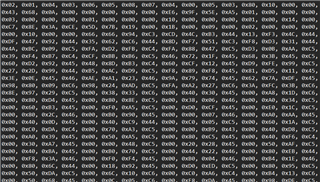
I am working with IWR6843ISK and flashed the sensor with high_accuracy_demo.bin from C:\ti\mmwave_industrial_toolbox_4_10_1\labs\Level_Sensing\prebuilt_binaries. I am able to see the data on "high accuracy demo visualizer 2.0" and also on the coolTerm. Here is a snippet of the data:

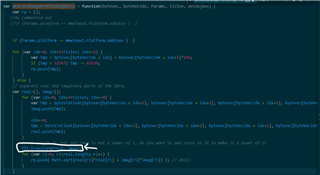
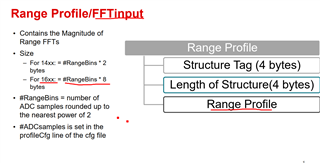
I want to separate and plot the FFT 1D data. I have followed the "high_accuracy_demo_package_structure.pdf" for understanding the structure. It says that:

I have two queries here:

1. The structure is given for 16xx and 14xx mmWave Sensors. Would it be same for IWR68xx?

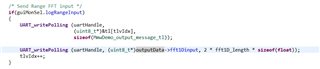
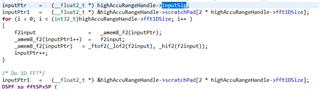
2. If yes, how should I process the bytes to get Range FFT plot as seen in the demo visualizer (after following the structure in the above file)?

Thanks,

Kamlesh

  • Hi Kamlesh, 

    1. The structure of the IWR68xx UART data will follow that of the 16xx format.  The 16xx/68xx version of the lab utilizes the on-chip DSP, which results in higher resolution as well as a much larger FFT size.
    2. To process the UART data, there are some Python scripts located at: *install_location*\mmwave_sdk_03_05_00_04\packages\ti\demo\parser_scripts.  These scripts are written for the Out of Box demo data format, but could be modified for the High Accuracy Level Sensing lab data format.  You may also find this E2E thread helpful: https://e2e.ti.com/support/sensors-group/sensors/f/sensors-forum/978925/iwr6843aopevm-iwr6843aopevm

    Regards,

    Brennan

  • Hi Brennan,

    Thank you for your response.

    I tried the scripts you mentioned. I changed few parameters and tried to run them. But couldn't get the desired results in terms of range, peak values, fft values as seen in the demo visualizer.

    On the other side, I converted the javascript code (only the processDetectedPoints() function given in the mmw_HighAcc.js file ) into a python script. It does seems to be working and gives peakvalue, and three distances. I will test it out more.

    Further, I want to get the FFT data from the UART packet. In the demovisualiser Js fil mmw_HighAcc.js-> function() processRangeProfileHighAccu() implements it. However, I also see that this function does a fft over the data after separating the bytes into real and imaginary parts. I am confused here. Why is there a need to do fft again, if we already have fft data in the UART packets? Or am I missing something serious here?

    Regards,

    Kamlesh

  • Kamlesh, 

    The High Accuracy Level Sensing lab implements a zoom FFT technique, which involves two steps:

    1. Taking a 1D coarse FFT in order to search for a peak
    2. Taking a zoom-in FFT which analyzes a portion of the peak spectrum at a much higher resolution

    Hence, the reason for two FFTs.  You can find more information on this on the Level Sensing Lab page.

    Regards,

    Brennan

  • Hi Brennan,

    Thank you for your response. I have one more doubt with regard to data streamed to UART. It seems from the Level sensing High Accuracy Demo for 68xx, the FFT data streamed is actually the data prior to FFT being calculated. Is this understanding of the Uart Data structure correct? I am attaching the snippet of the code where the FFT (Input) data is streamed to UART.

  • Kamlesh, 

    Please see the following flowchart:

    The processing and FFTs are performed in the DSS, and streamed to UART in MSS (as in the snippet of code you sent).

    Regards,

    Brennan

  • Hi Brennan,

    I am not sure if my question was clear to you. In the 68xx high accuracy project (downloaded from Industrial toolbox4.10-> labs -> level sensing). I analyzed the code and the UART data. It seems to me that this is the NOT the FFT Data, rather it is the data which is being fed to Coarse 1D FFT calculator (in the function RADARDEMO_highAccuRangeProc_priv.c). I would like to access the Coarse FFT data over the UART.

    (1)The InputSig points to buffer containing ADC data, (3) assigned to fft1DIn, (2) Later fft1DIn is assigned to fft1Dinput. -> Hence the conclusion, that the ADC data is being streamed out through UART. Please clarify here. 

    A supporting snippet from RADARDEMO_highAccuRangeProc_priv.c; InputSig is used to calculated 1D Coarse FFT.

    Regards,

    Kamlesh

  • Hi Kamlesh,

    Yes, I believe your understanding to be correct, that this is the RAW ADC (IE the input for the first FFT) being fed out over UART.

    Best Regards,
    Alec

  • Thank you for the confirmation and support. Query Resolved.