


Dear TI:
We are having some questions while doing a quad chip cascade board(AWR2243 DSP-EVM+RF-EVM) calibration and would like to hear some answers.
We deployed the experimental conditions (dark room, 5m, 1RCS corner reflector) as per the manual and performed BF calibration.
We compare the calibration results with the manual results, as shown in Figure 1. The experimental results have the same trend as the manual results, including the intermediate process, only there are some deviations in the amplitude and line spacing.
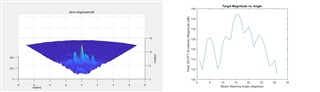
figure 1
Then we tested a single target based on the calibration data, and the experimental results are shown in Figure 2
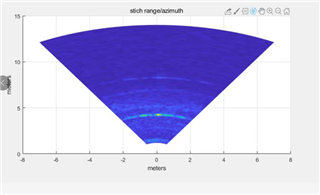
figure 2
Our questions are:
1) From Figure 1, the results of our calibration are consistent with the results of the manual. Does it indicate that there is no problem with the calibration?
2)On the TI manual, the BF image results were once given, as shown in Figure 3. It is clear that the BF scan results in the manual are concentrated and clearly imaged. But our results have large sidelobes. What is the reason?
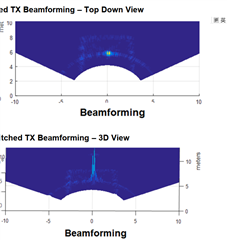
figure 3
3):Question 3: Is the reason for this deviation entirely due to incorrect calibration? If not, are there other factors involved? For example, other processing algorithms are used?
