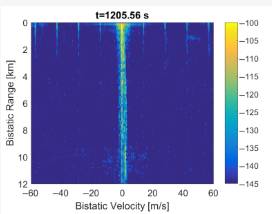
Hello TI experts,
I'm new to all this radar and I sorry in advance if the question sounds dumb to you but could someone let me know why there is a high amplitude line in middle of the range-doppler map along the range axis? Many thanks in advance.
This thread has been locked.
If you have a related question, please click the "Ask a related question" button in the top right corner. The newly created question will be automatically linked to this question.
Hello TI experts,
I'm new to all this radar and I sorry in advance if the question sounds dumb to you but could someone let me know why there is a high amplitude line in middle of the range-doppler map along the range axis? Many thanks in advance.
Hi,
Firstly there is no question as dumb question. Secondly, please feel free to ask anything related to TI Products on TI e2e.
So you are looking at a range vs doppler map which plots the range(1D FFT) and doppler(2D FFT), hence you see a static object being plotted at 0 doppler bin over captured chirps/frames data.
Regards
Thans for your reply.
The line go along the range axis from 0 to 12km, is that indicate there is a static object at every range bin?
Hi,
So i dont think it is in KM, as the typical range is in meters. Secondly, it is indicating that there is clutter beyond certain distance however if you adjust the y axis then you may see a strong peak for the some closer object detected(if present).
Regards