Hi all
My customer has the below question.
Please review and comment.
Best regards
Ueli
-----------------------------
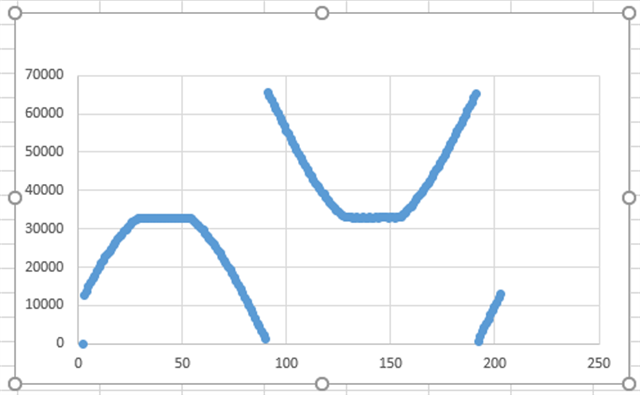
I have a specific question about the TMAG5273. The raw x and y magnetic data look like the plot below, with the negative portion of the sinusoid appearing at the top of the plot. It does not seem to cause any issue in calculating the angle, but the plots I see on the datasheet and app notes show a continuous curve. Do you know what might be causing this and how I could fix it? Please ignore the clipping that issue has been solved I just don't have a picture without it.