


Dear engineers in TI,
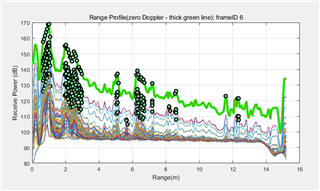
For the signal processing script 'cascade_MIMO_signalProcessing.m' in matlab, what is the thick green line mean? And why is it the (Doppler FFT size)/2+1 column of sig_integrate?
Regards,
Garrett
Original question:

Dear engineers in TI,
For the signal processing script 'cascade_MIMO_signalProcessing.m' in matlab, what is the thick green line mean? And why is it the (Doppler FFT size)/2+1 column of sig_integrate?
Regards,
Garrett
